
Beirut SE
Current year high: 1,200.49 Current year low: 991.49
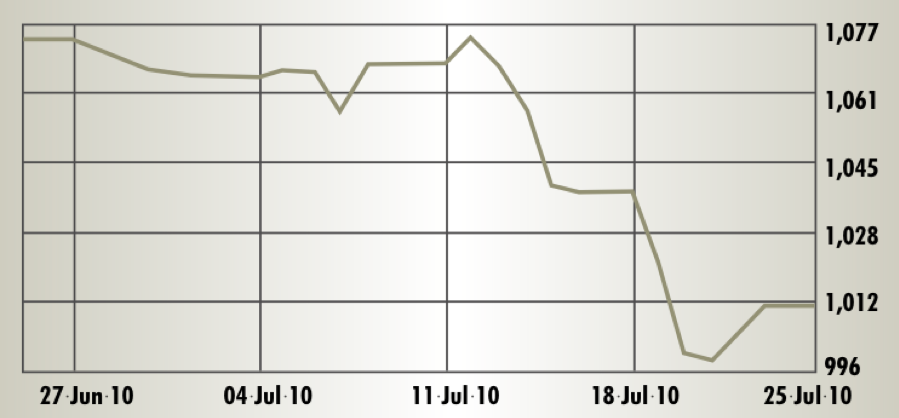
> Review period: Closed July 23 at 1010.55 points Period change: -5.2%
The MSCI Lebanon index continued trending flat with a downward bias in the early part of July but then dropped sharply in the latter part of the review period, making the Beirut Stock Exchange the weakest performer among MENA bourses. Much of the downward trend was focused on the real estate sector and its dominant stock, Solidere. The two-tiered scrip weakened by 8.1% and 8.7% in the review period, with most of that drop an ex-dividend allocation on July 14. Stocks in the banking sector also mostly fell; only Bank of Beirut closed the period with a marginal gain.
Amman SE
Current year high: 2,693.91 Current year low: 2,303.44
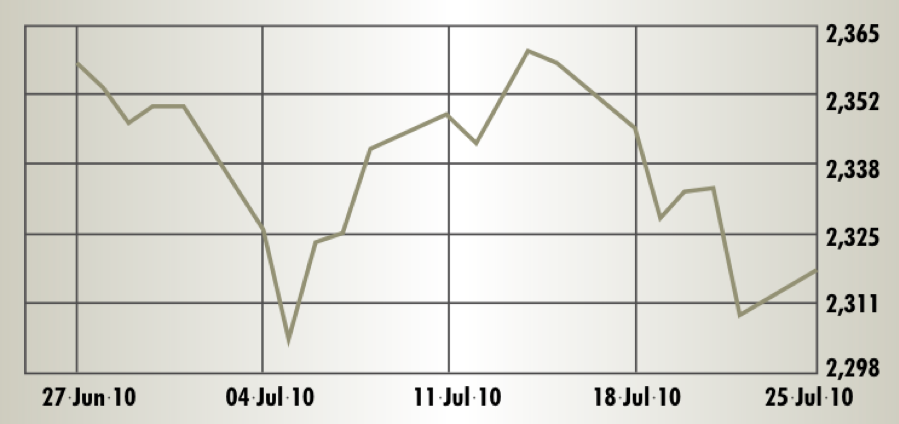
> Review period: Closed July 22 at 2,307.87 points Period change: -1.7%
The Levant stock exchanges were notable losers in July. A 350-point intra-month climb on the Amman Stock Exchange was not sustained by investor sentiment and the ASE index slumped back to a July 22 close that was just a notch above the latest multi-year low, which the index had passed through on July 5. The services sector was the best performer between Jul 1 and 22, managing a gain of 0.9%. Banking was range-bound to the general index, or vice versa; industry and insurance underperformed.
Abu Dhabi SM
Current year high: 3,239.74 Current year low: 2,467.04
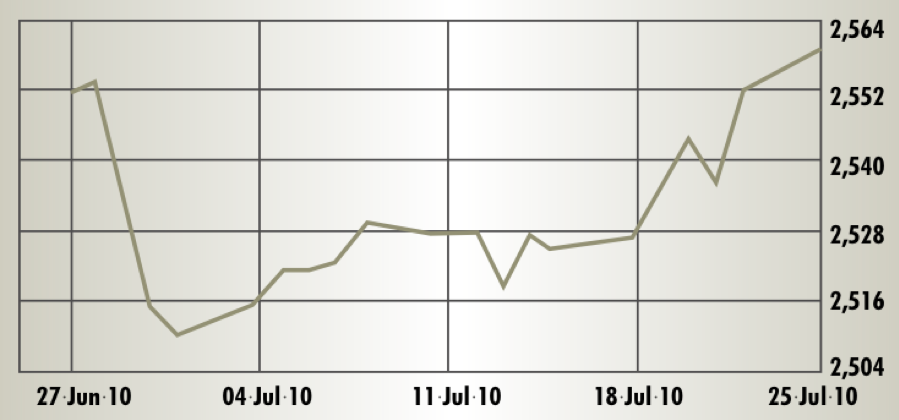
> Review period: Closed July 22 at 2,550.98 points Period change: 1.5%
Continued declines in trading volume from earlier weeks and volatility of less than 4% created an image of a fairly normal shift into the summer vacation season on the Abu Dhabi Exchange. However, the ADX index is still 7% down when compared with the start of 2010, making it the GCC’s second biggest loser for the year to date after Dubai. The energy index was the upward outlier among ADX sector indices, with a 20.7% climb in July. As far as individual companies, eight ADX stocks achieved double-digit gains, led by delisting candidate Aabar Investments (+40.1%).
Dubai FM
Current year high: 2,373.37 Current year low: 1,461.80
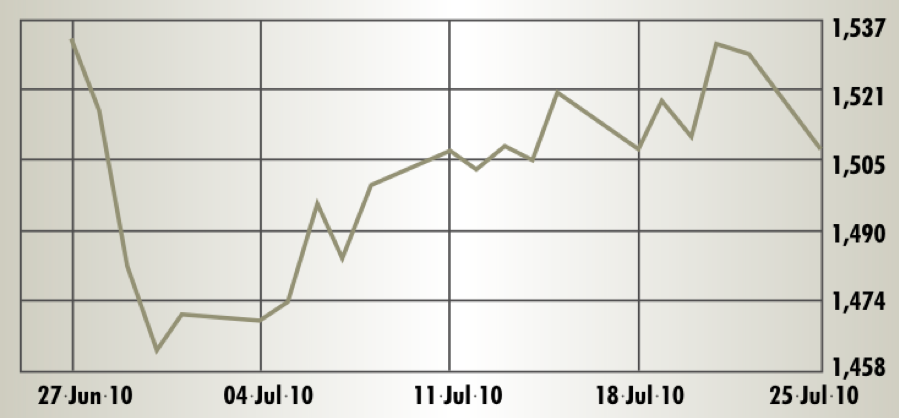
> Review period: Closed July 22 at 1528.97 points Period change: 4.6%
Fresh into the second half of the year, the Dubai Financial Market index booked the GCC’s best gains — but only when compared with the start of July. Wearing mirror coated sunglasses outside and inside were the accessory recommended to investors who wanted to look cool and stay calm in the face of the DFM benchmark index’s fat drop of 15.2% from the start of the year — the MENA’s steepest year-to-date fall on the review date and even 1.2 percentage points down from 30 days earlier. Of indices around the globe, not many have shown a steeper downside in 2010.
Kuwait SE
Current year high: 7,964.30 Current year low: 6,319.70
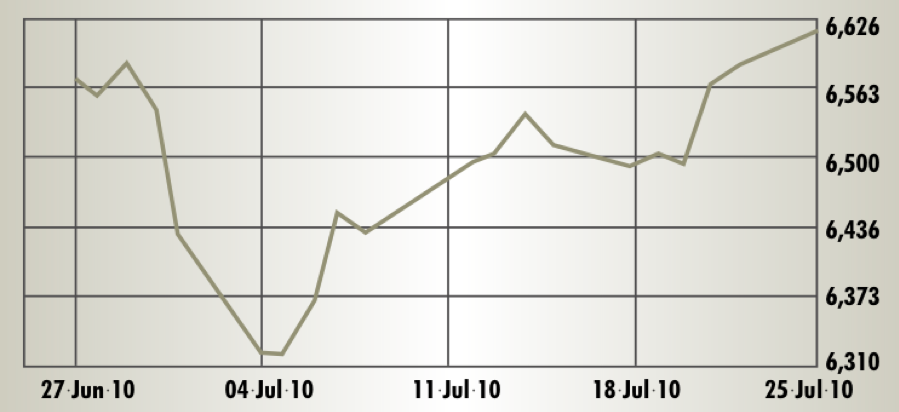
> Review period: Closed July 22 at 6,582.60 points Period change: 0.6%
With the start of July, the Kuwait Stock Exchange index promptly dropped below 6,400 points for the first time since March 2009. As the index clawed its way back above the 6,500-point line by July 13, most sector indices followed the benchmark’s modest gains. Insurance and non-Kuwaiti stocks lagged behind, however, ending the review period 7.7% and 5.8% down. The KSE is down 6% year-to-date but at least July trading volumes (and volatility) were up when compared with the June review period.
Saudi Arabia SE
Current year high: 6,929.40 Current year low: 5,617.31
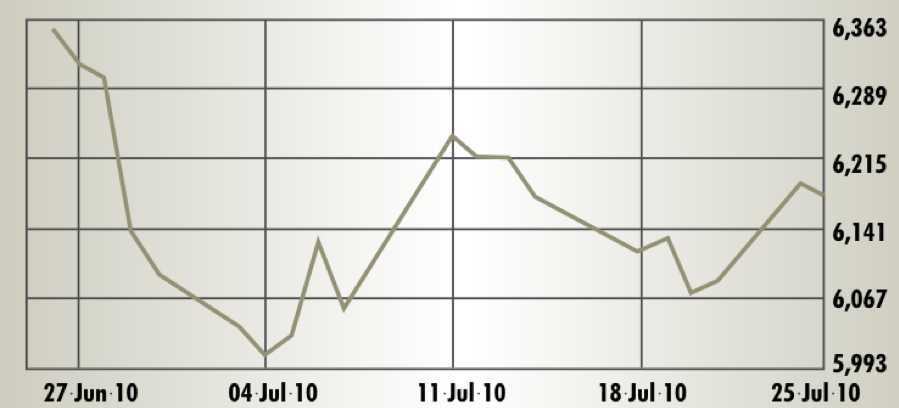
> Review period: Closed July 21 at 6,089.95 points Period change: -0.1%
The Saudi Stock Exchange was, by measure of its 14.31x P/E ratio, the most expensive GCC bourse at market close on July 21. The TASI benchmark index, which had entered the second half of 2010 on a downtrend followed by a short lived 240-point rise in the second week of July, ended the review period with marginal drops on both the month and the year. Manufacturer SABIC, who showed big increases for gross and net income in both the last quarter and the first half, gained 0.9% between July 1 and 21.
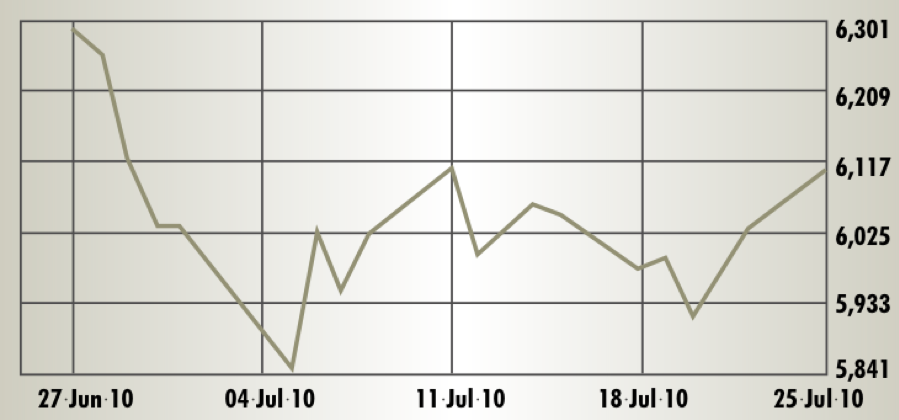
Muscat SM
Current year high: 6,933.75 Current year low: 5,263.94
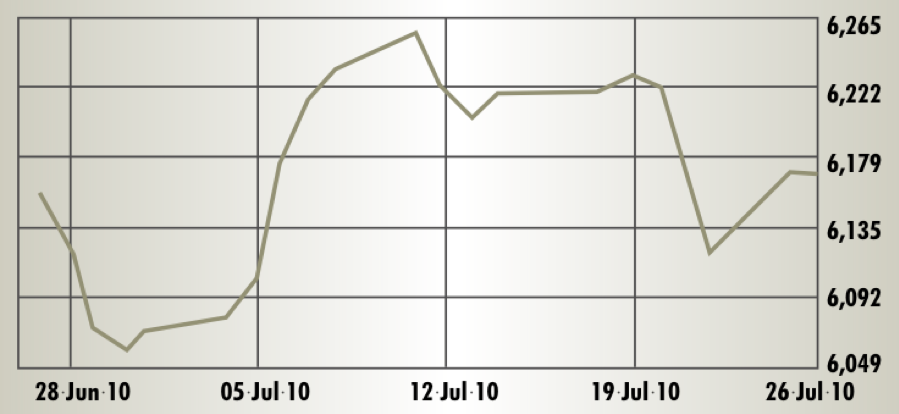
> Review period: Closed July 22 at 6,117.25 points Period change: 1.0%
Although the Muscat Securities Market had a better start into the second half of 2010 than several other GCC stock exchanges, the MSM index softened toward the end of the review period under selling pressure. This reduced the Omani market’s gain to the same 1% range as its peers in Qatar, Kuwait, Abu Dhabi, and Bahrain. As in the previous month, the industrial index in July was the best performing sector on the MSM. Dhofar Poultry Co flew up 57.5% to the rung of the review period’s top gainer. It accomplished this feat with two small trades on Jul 22.
Bahrain SE
Current year high: 1,605.98 Current year low: 1,361.19
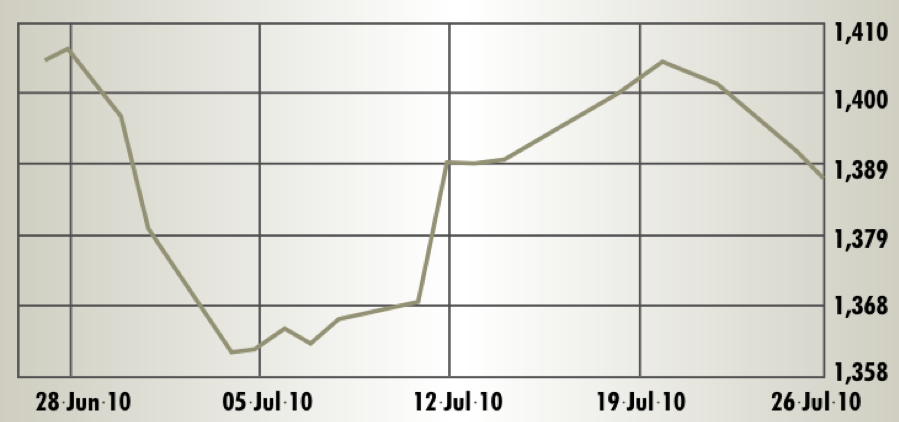
> Review period: Closed July 22 at 1,401.42 points Period change: 0.4%
Visibly lower daily trade volumes than in the two previous months and a twelve-month index low on July 4 were talking points on Bahrain Stock Exchange performance going into the second half of 2010. The BSE’s recovery from being oversold at the start of the month allowed it to end the review period with a positive twist. The banking and insurance sub-indices outperformed but the investment index underperformed the general index. Inovest, an Islamic real estate developer, was the period’s best gainer and closed up 21.7%.
Doha SM
Current year high: 7,801.33 Current year low: 6,502.93
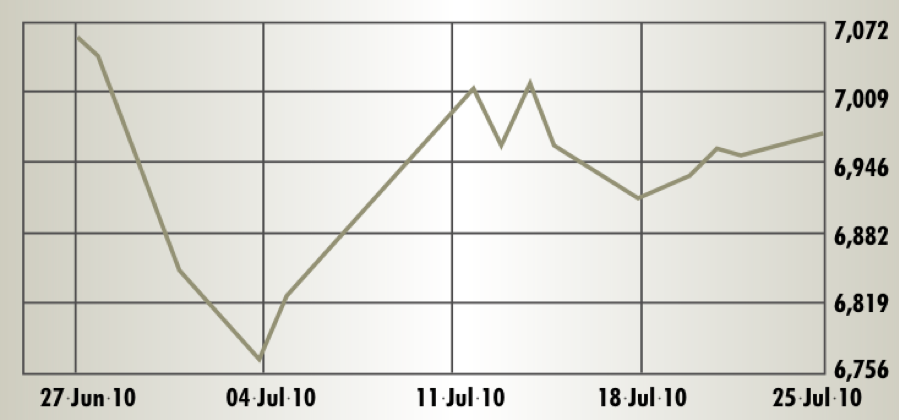
> Review period: Closed July 22 at 6,951.89 points Period change: 0.8%
Like its GCC peers, the Qatar Exchange hit a seasonal low right at the start of the third quarter and as on other bourses near and far, the QSE index trends appear to be reflections of uncertainty. For the year to date, the QSE was basically flat at the close of the July 22 session. Whereas sub-indices for banking, services and industry moved range-bound with the general index, the insurance index recorded more pronounced fluctuations and closed the period 2% up. Qatar Islamic Insurance (+21.2%) and Al Khaleej Insurance (+17.2%) were the best performers.
Tunis SE
Current year high: 4,971.94 Current year low: 3,615.36
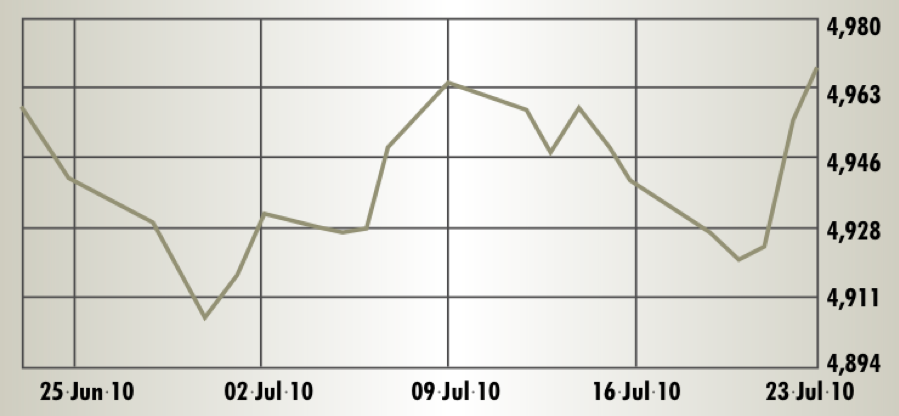
> Review period: Closed July 23 at 4,969.66 points Period change: 1.3%
Another high floating month in Tunis. After scaling a new historic high on June 21, the Tunindex saw a week of mild profit taking before upward motion resumed with the first session of the third quarter. The Poulina Group conglomerate started July with a furious rally, driving the stock higher 16.1% to market cap above $1.1 billion. Other top gains came from two newcomers. June debutant Carthage Cement Co, although softening after an intra-month price peak, gained 13.8% in the review period. Automotive company ENNAKL, who debuted on July 16, was up over 52% by the July 24 close.
Casablanca SE
Current year high: 12,457.59 Current year low: 9,997.56
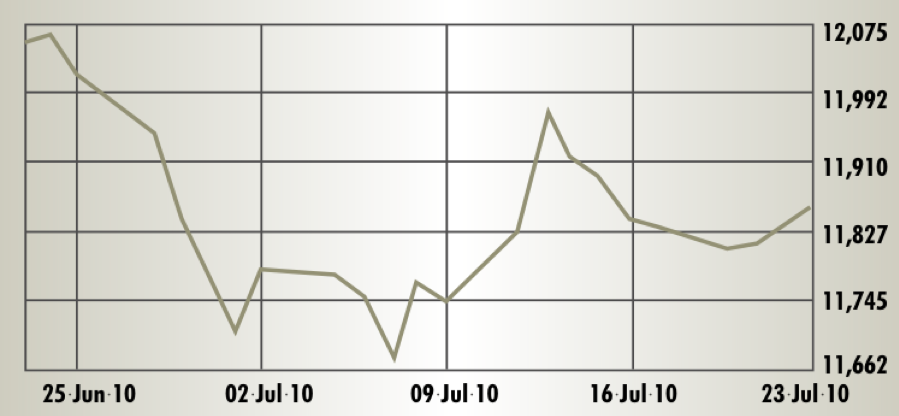
> Review period: Closed July 23 at 11,857.08 points Period change: 0.7%
The Casablanca Stock Exchange started the second half of 2010 with more up and downs than its Tunisian peer, resulting in 8% volatility in the MASI versus about 4% on the Tunindex. Although losers outnumbered gainers in the review period on the Moroccan bourse, the leading stocks by market capitalization closed the period up. Maroc Telecom gained 4% and Attijariwafa Bank, 0.6%; Tunisian automotive dealer ENNAKL dual-listed from day 1 on the Moroccan market where it gained 6.7% by July 24 close.
Egypt CASE
Current year high: 7,603.04 Current year low: 5,850.00
> Review period: Closed July 22 at 6029.00 points Period change: -0.1%
Thinking global trends while buying local stocks has been a well-entrenched pattern in investor behavior on the Egyptian Stock Exchange as well as other regional bourses. But what to think if global markets are in confusion and signals are all mixed? Largely thanks to global market impacts, the EGX 30 index was a beacon of volatility in the July review period, at 21.2%. Small and medium sized stocks by the bundle recorded double-digit gains, but not so the Orascom twins.