
Beirut SE
Current year high: 1,200.49 Current year low: 991.49
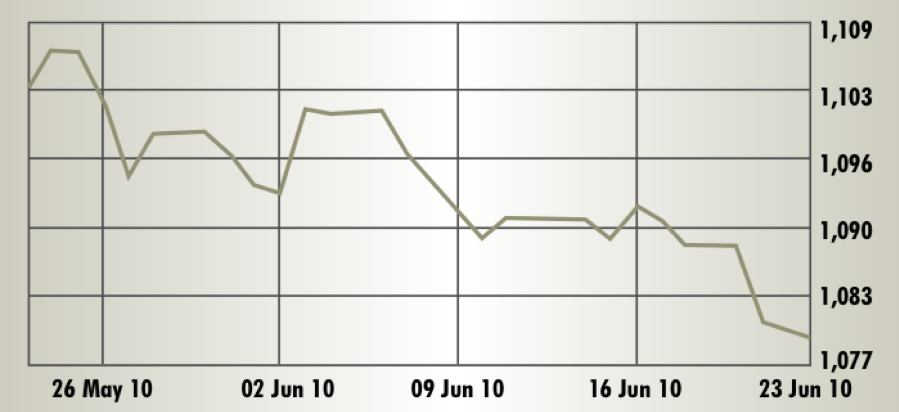
> Review period: Closed – June 22 at 1079.28 Points Period Change: -1.5%
The MSCI Lebanon index trended lower in a not overly dramatic fashion in the June 2010 review period, leaving all the excitement for Lebanon’s army of devoted football fans. When compared with its high of 1,180.98 points for the first half of 2010, the index softened by just over 100 points. However, the banking sector could show off another victory with a 31% y-o-y rise in its Q1 2010 aggregate net profit of the top 12 lenders. Market cap leader Solidere scored a goal of $189 million net profit last year in a stable performance.
Amman SE
Current year high: 2,744.07 Current year low: 2,320.14
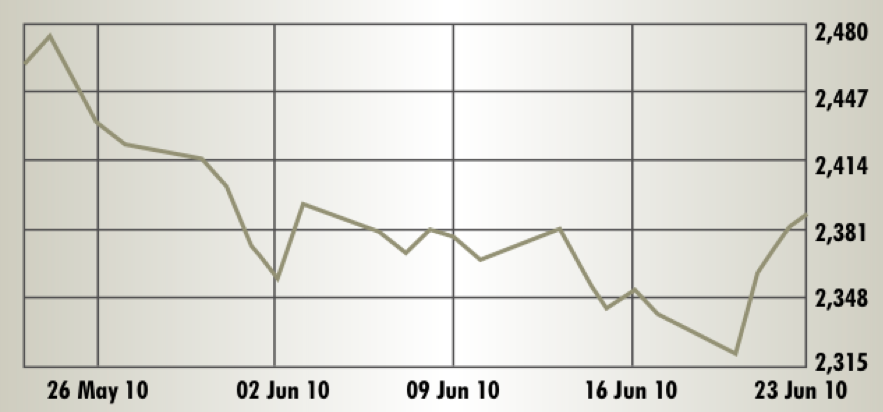
> Review period: Closed – June 23 at 2,388.94 points Period Change: -0.5%
Having just passed across a multi-year low of 2,320.14 on June 20, the best wish for the Amman Stock Exchange may be for this to have been rock-bottom for the market and for new stamina to appear after the disappointing first-half. Sadly, endurance training seemed to be of no help to the insurance sector, which dropped 15.2% at the bottom of market trends. Banking, industrial, and services sectors, by contrast, traded range bound with the ASE general index and banking even achieved a tick into positive territory, starting from June 21.
Abu Dhabi SM
Current year high: 3,239.74 Current year low: 2,467.04
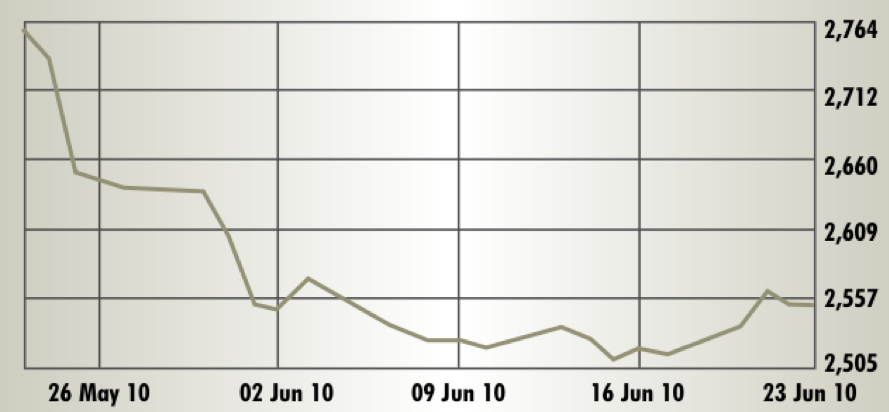
> Review period: Closed – June 23 at 2,551.39 Points Period Change: -2.0%
Abu Dhabi’s exchange has dropped a sizeable 7% from the start of 2010, though this decline is only half as steep as the plunge Dubai’s DFM took over the same period. The ADX exhibited some noticeable volatility in June and sector indices fluctuated in uncoordinated trends. The only sector index to end the period in positive territory, however, was the industrial index. Market cap leader Etisalat weakened 2.4% as Methaq Takaful and Gulf Livestock were beaten down 28.4% and 26.8%, respectively. The best gainer was Finance House, up 18.6%.
Dubai FM
Current year high: 2,373.37 Current year low: 1,487.93
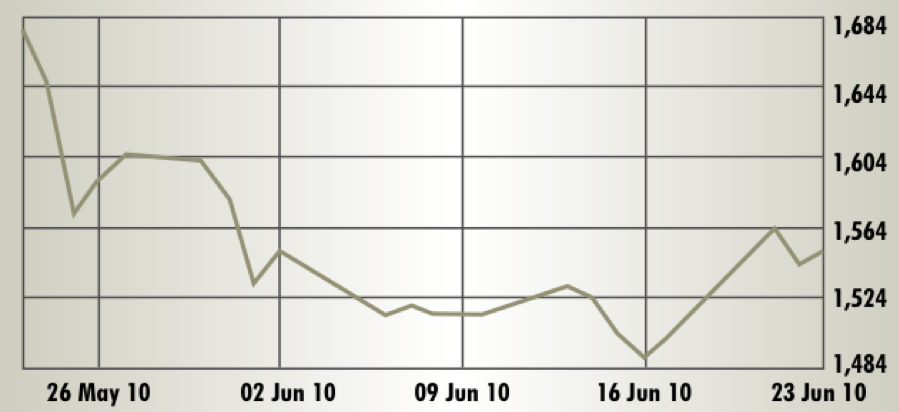
> Review period: Closed – June 23 at 1551.19 Points Period Change: -1.8%
The ‘lord of the dip’ award goes hands-down to the Dubai Financial Market for the first half 2010. With the halfway point for 2010 quickly approaching, the DFM was down 14% for the year to date at its June 23 close and danced around 1,500 – levels last seen in February 2009. No vigor, no football competition, no cultural happening seemed to energize the DFM, where a 10.7% climb of Aramex stock was the only upward outlier. The vast majority of shares tended to the red, as did the sector indices, except for transport.
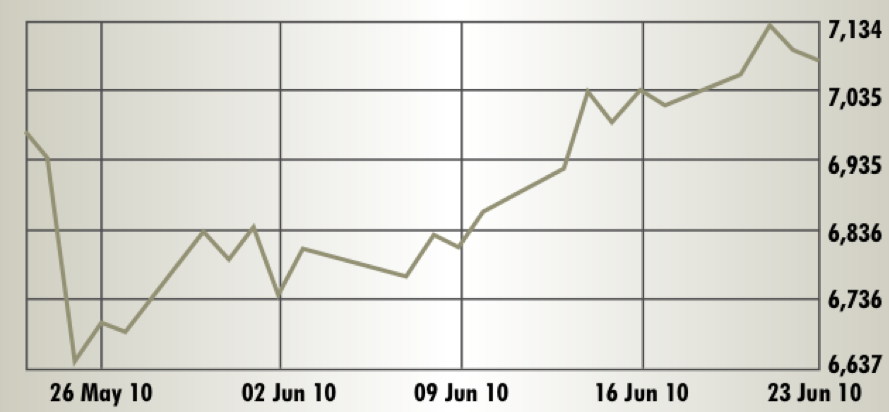
Kuwait SE
Current year high: 8,140.20 Current year low: 6,528.60
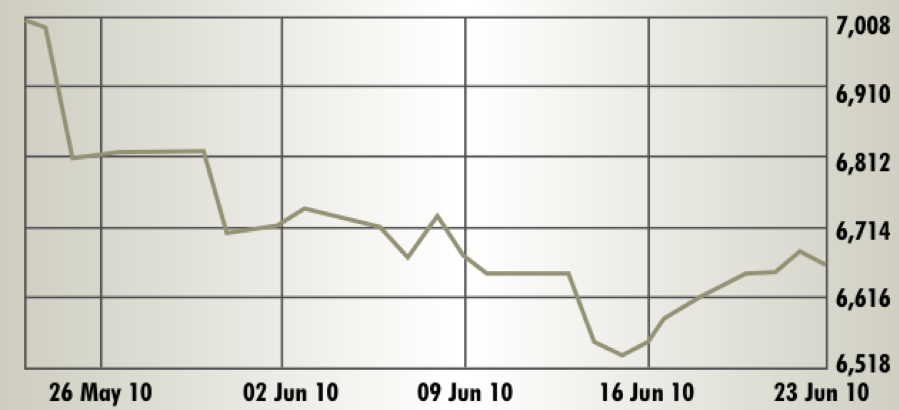
> Review period: Closed – June 23 at 6,653.00 Points Period Change: -0.7%
The fact that the Kuwait Stock Exchange closed less than one percent down in the review period cannot soften the harsh realities of the bourse’s massive slide in May, which didn’t stop until the index hit a 15-month low of 6,528 on June 15. It remains to be seen if this will be rock bottom for 2010, or if investor nerves have worn so thin that share price performance in Kuwait will fall further. Banking and industry were better than the general index; real estate and investment underperformed.
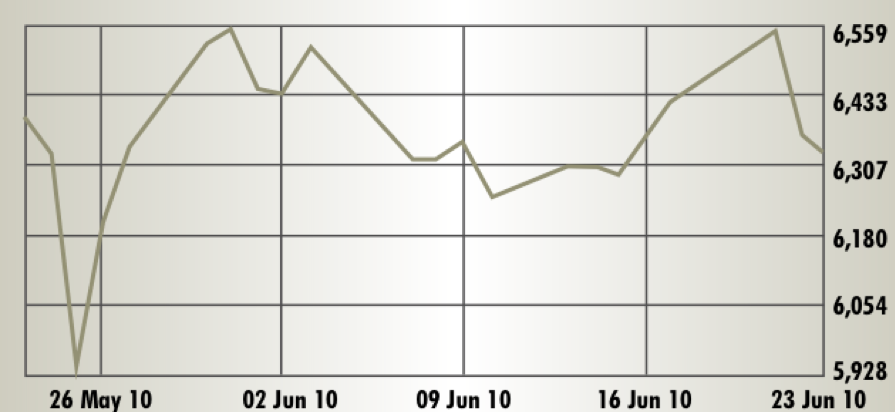
Saudi Arabia SE
Current year high: 6,929.40 Current year low: 5,407.31
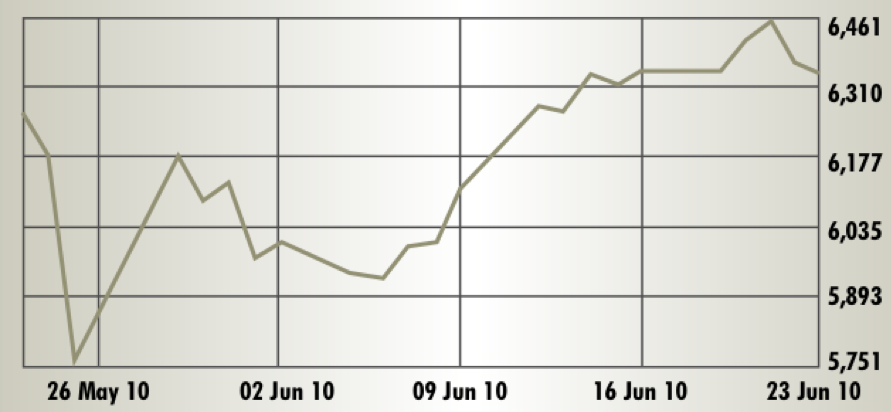
> Review period: Closed – June 23 at 6,343.47 Points Period Change: 3.6%
After its immune system took a hit from various contagions in the second half of May, the Saudi Stock Exchange resurged in June, in a manner of speaking. Compared to its GCC peers, the SSE index was second best performer in the review period and for the year to date it is still the best student in the GCC securities college, with a 3.6% climb. Most SSE sub-indices moved range-bound with the TASI in the review period; a news-driven 23.1% spike in the Energy and Utilities index was the upward exception.
Muscat SM
Current year high: 6,933.75 Current year low: 5,263.94
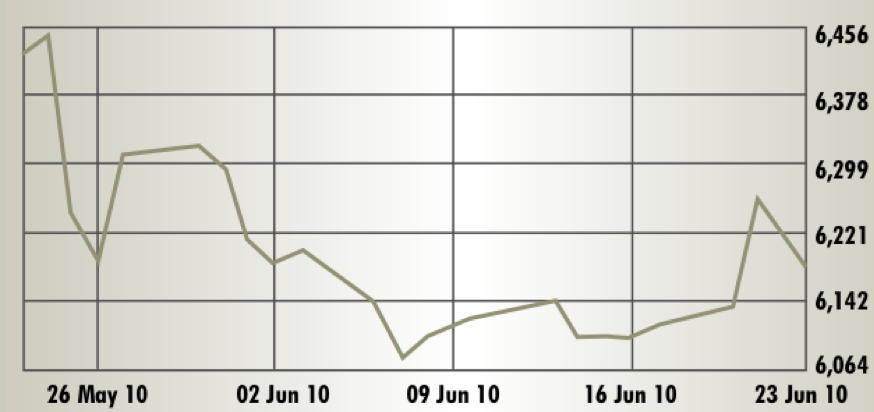
> Review period: Closed – June 23 at 6,173.33 Points Period Change: -1.3%
The Muscat Securities Market had more losers than winners in the review period and the general index seemed to be finding its feet after two months of down pressures. While the industrial sub-index was the June market’s consistent best performer, banking had the most erratic ride. Brokerage Financial Services Co was the MSM’s best individual performer in June and shot up 19.6%, reversing a comparable drop it had suffered in May. National Mineral Water Co found no such mercy, dropping 21.6% from June 1 to 23.
Bahrain SE
Current year high: 1,613.01 Current year low: 1,390.81
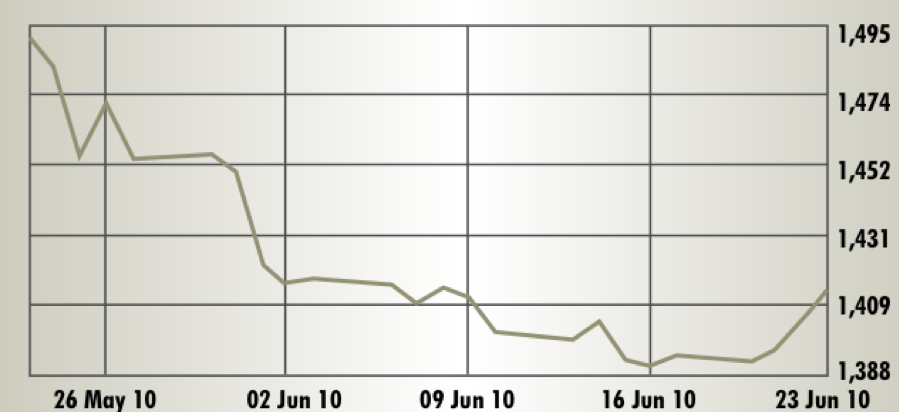
> Review period: Closed – June 23 at 1,413.19 Points Period Change: -2.6%
Although the BSE’s bow beneath the 1,400 point line between June 15 and June 20 was merely a six-month low, and although the year-to-date performance of minus 3.1% is only the fourth worst in the seven GCC security markets, Bahrain’s investors will still be hoping the second half of 2010 bestows more blessings than the first. While Esterad Investment fell 28.3% in the review period, a gain of 2.63% was made by Al Salam Bank – Bahrain, the period’s best performer.
Doha SM
Current year high: 7,801.33 Current year low: 5,731.30
> Review period: Closed – June 23 at 7,072.08 Points Period Change: 4.2%
Though the Gulf region has no team in the World Cup to bring home glory, the Qatar Exchange took this month’s trophy for greatest market vigor. After its epic 1,250-point slide between April 13 and May 25, the ensuing gains of June made for a picture perfect V-shaped performance, albeit a V that is still rather short on the upside. The QE’s four sector indices all were positive, with insurance coming out on top as best performer. Was it because the country iterated another energetic bid to host a World Cup (2022)?
Tunis SE
Current year high: 4,772.39 Current year low: 3,337.48
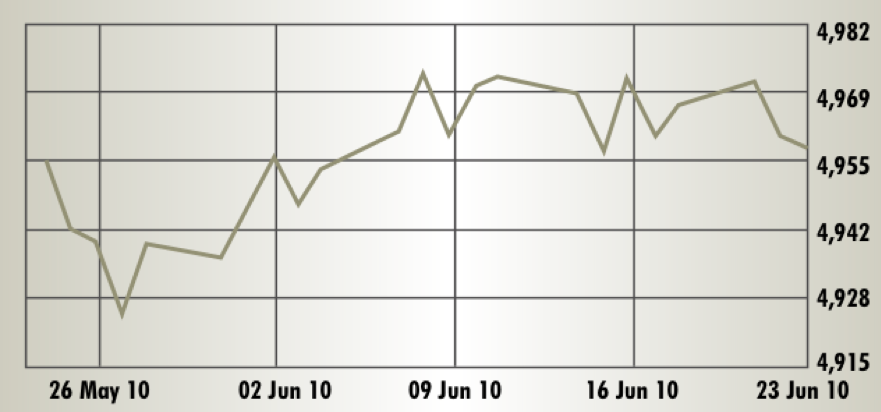
> Review period: Closed – June 23 at 4,957.85 Points Period Change: 0.4%
Minimal volatility and sideways trading at the ceiling of historic performance was the game on the Tunisian Exchange. The period close represented a tiny retreat, by not even 15 points, from a new index peak of 4971.35, which was scaled on June 21. The market reported a smashing success in the initial public offering of cement maker Carthage Cement. The $89 million share offering for 49.8% in the company’s stock was oversubscribed more than 13 times and the stock debuted on June 22 with a first-day change of 26.3% when compared with the issue price.
Casablanca SE
Current year high: 12,457.59 Current year low: 9,997.56
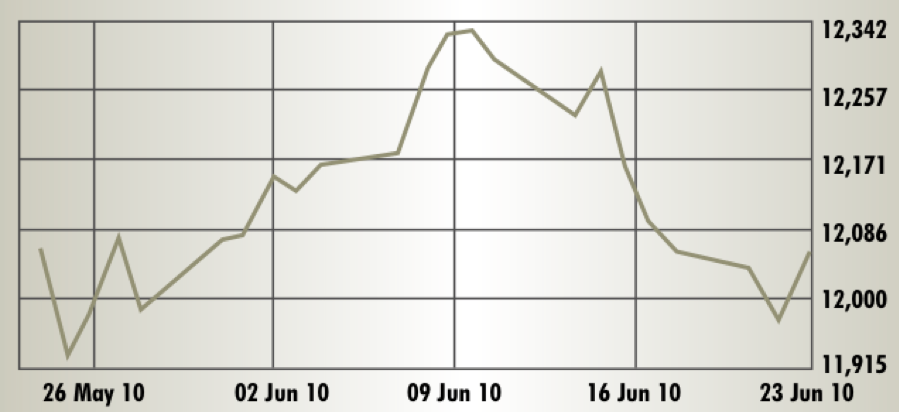
> Review period: Closed – June 23 at 12,055.36 Points Period Change: -0.1%
The June 2010 match between bulls and bears on the Casablanca Stock Exchange was a draw. As the impact of the downturn in most global markets in late May caused the MASI to correct from record highs of almost 12,500 points, the optimists dominated on the pitch in the first eight sessions of the review period, but the bears came back in the second eight sessions for a flat net balance. Market cap leader Maroc Telecom advanced 4.7%, and leading bank Attijariwafa dropped 1.8%.
Egypt CASE
Current year high: 7,603.04 Current year low: 5,229.40
> Review period: Closed – June 23 at 6,319.00 Points Period Change: -3.5%
The highest volatility in North African markets marked the flow of trade on the Egyptian Stock Exchange in the June 2010 review period. After a massive drop and sharp rebound between May 18 and 31 into the mid 6,500 range, the EGX 30 fell more than 300 points to June 10, recovered by almost exactly the same point score, and weakened again. Telecom Egypt managed a flat performance but Orascom Telecom lost 14.7% as analysts questioned its planned divestment from Algeria.