
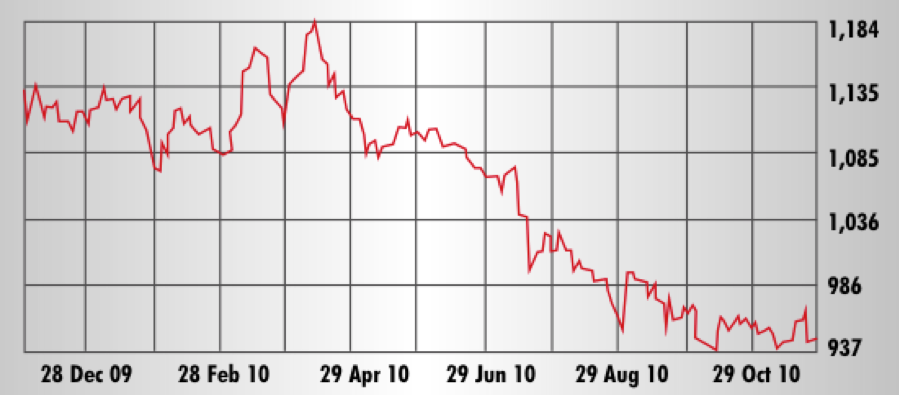
Beirut SE
Current year high: 1,180.99 Current year low: 939.02
> Review period:
Closed Nov 26 at 946.14 Points 47 Week Change: -15.2%
Beirut in November not only consistently beats international financial centers like London, New York, and Tokyo in terms of weather quality but in 2010 also proved again that the Beirut Stock Exchange is hardly swayed by global selling pressures — Irish debt or North Korean artillery assaults — that scared investors elsewhere. The BSE has its very own chimeras, the current one can be christened Special Tribunal for Lebanon (STL) phobia. This fear influenced the pattern of Lebanese share movements, making for a dull second half of 2010. Weakness in the share price of real estate stock Solidere, whose year-to-date drop of 22.5% contributed a large chunk to Lebanese index drops in 2010, seems to have no remedy until the STL storm has run its course or political waters calm by other means. Still an illiquid and bipolar market of banking and real estate, 2010 changed the BSE market cap profile notably in favor of banking. Top banking pair, Audi and BLOM, represented more than 50% of BSE market cap in November while the weight of Solidere was reduced to about 25% of the total.
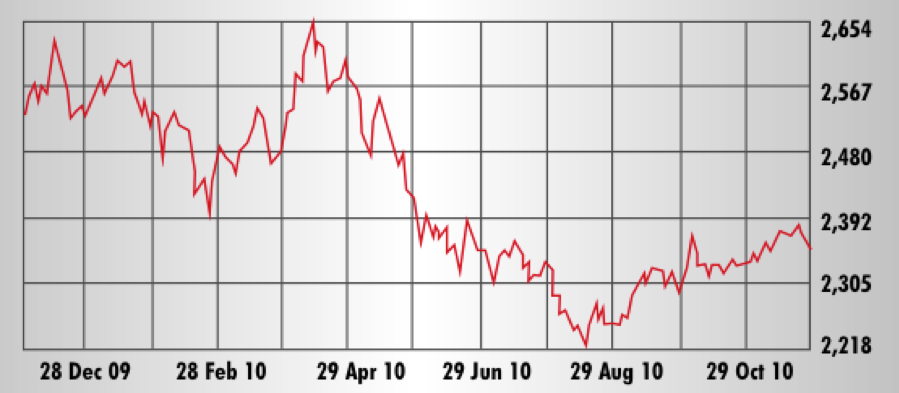
Amman SE
Current year high: 2,648.36 Current year low: 2,223.30
> Review period:
Closed Nov 25 at 2373.24 Points 47 Week Change: -7%
The Amman Stock Exchange could breathe better toward the end of November after the harsh days of summer, given that the ASE benchmark index climbed 5.5% from September 1 through Nov 25. But the reprieve has not been enough to balance the losses Jordan’s bourse took in 2010 under pressure from diminished confidence and outflows of regional cash. Interim earnings reports were also none too reassuring. While Housing Bank for Trade and Finance and Arab Potash showed nine-month profit increases, three other ASE heavies — Arab Bank, Jordan Phosphate Mines and Jordan Telecom — reported net profit contractions in the same period. Losers on the ASE outnumbered gainers across the board in the year to date; this was reflected in the sector indices all coming home negative. Banking was the relative best, with a drop of 5%, followed by industry whose 7.9% loss narrowly trailed the general index. Services, however, gave up 10.5% while insurance took the deepest plunge with a 45.3% index fall.
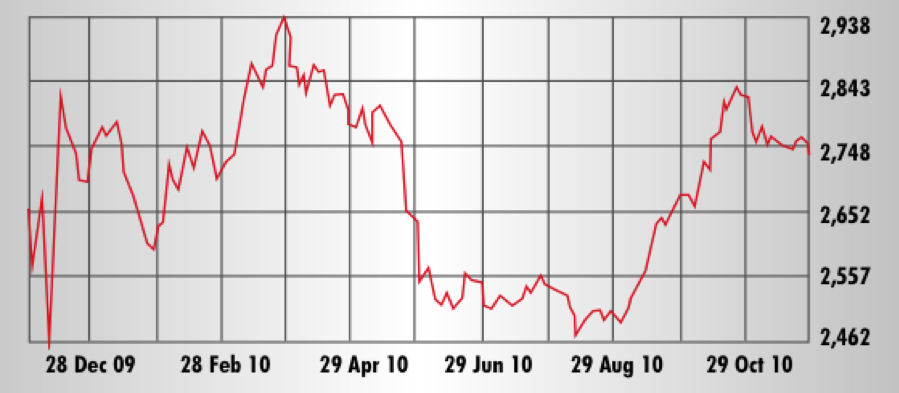
Abu Dhabi SE
Current year high: 2,931.67 Current year low: 2,467.04
> Review period:
Closed Nov 25 at 2,756.89 Points 47 Week Change: 0.5%
Although the Abu Dhabi Securities Exchange showed gains in September and October, the autumnal improvements in the index positioned the ADX merely for a U-shaped performance. No heroic tales of rising from the troughs of wait-and-see and running with the bulls again. The sector index that stood as the bourse’s most tragic figure in 2010 was real estate, distinct in that it underperformed all other sectors from the beginning of the year and closed 47.5% down on November 25 when compared with January 1. Telecommunications and banking were the best performing sector indices, closing the review period up 8% and 6.5% respectively. Banks contributed many of the bright accents in the 2010 share performance picture, including Abu Dhabi Commercial Bank (49.3% up), Abu Dhabi Islamic Bank (25.8% up), and Union National Bank (14.1% up). ADX market-cap champion Etisalat closed the 47 weeks with a net share-price gain of 10.05%.
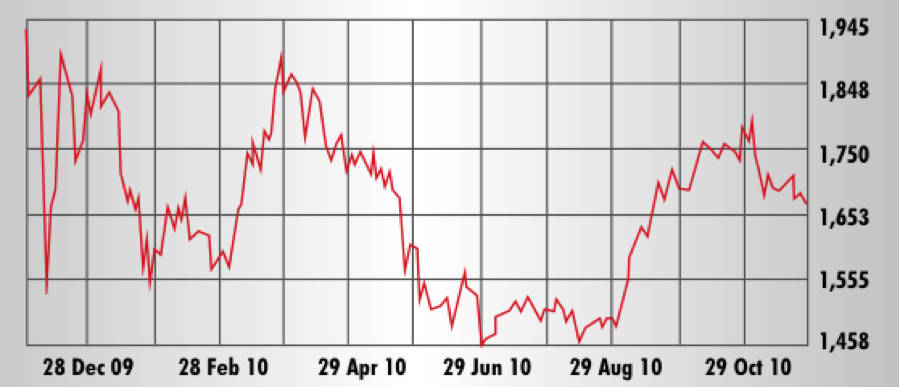
Dubai FM
Current year high: 1,889.99 Current year low: 1,461.80
> Review period:
Closed Nov 25 at 1682.23 Points 47 Week Change: -6.7%
Its cityscape may have filled up with urban architectural dreams, but the specter of debt towered above even Dubai’s tallest construction feats in 2010. Volatility on the Dubai Financial Market was reported at 21.6%, five percentage points above that of Tadawul as the GCC’s second most volatile market. Insurance, real estate, and investment sector indices — respectively dropping 14.5%, 18.9% and 22.2% from the start of 2010 — underperformed the disappointing general index. But the DFM’s utilities index somehow underperformed the underperformers by another 30 percentage points. Market cap leader Emaar closed at $0.99 on November 25, clocking in about 5% lower from its last close in 2009. Developers Deyaar, cooling and utilities scrip Tabreed, and investment firm GGIC were stocks with primary listing on DFM that each shed more than 45% in value during the 2010 review period. Logistics firm Aramex could be noted as an exceptional gainer this year, closing the 47 weeks 45.7% higher.
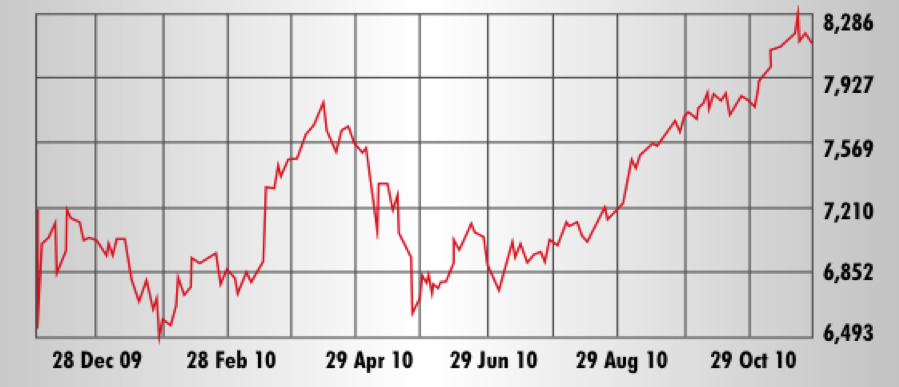
Kuwait SE
Current year high: 7,575.00 Current year low: 6,319.70
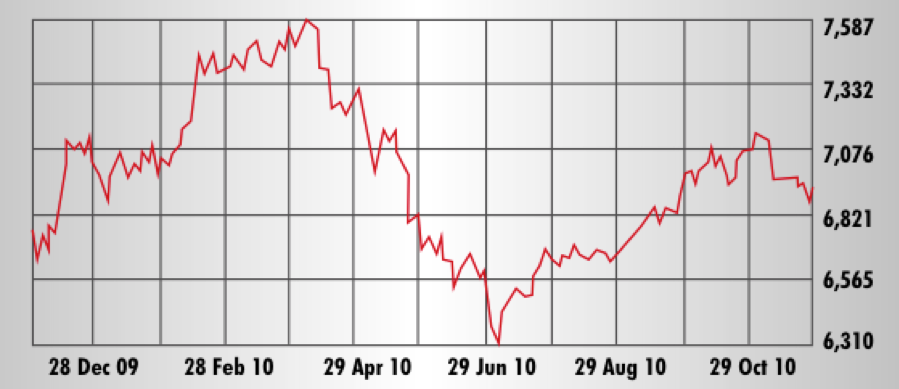
> Review period:
Closed Nov 25 at 6928.00 Points 47 Week Change: -1.1% The story of the Kuwait Stock Exchange in 2010 was more consistent than that of the SSE, if only in the sense that the KSE benchmark index exhibited fewer changes in direction. The overall result, however, was not too different from that of TASI, even as the KSE slipped just into negative territory at the end of week 47. Best price performances included those of major companies; with banks Ahli United (cross listed, up 55%), Boubyan (52%), NBK (36%) and telecoms firm Zain (41%) all up, four of the 10 largest stocks by market cap were among the market’s leading gainers. Seeing its index rise since midyear, banking was by far the best performing sector on the KSE with a year-to-date gain of 42.5% in the banking index by November 25. The real estate, investment and insurance indices were the underperformers, closing 15.9%, 12.6% and 9.8% lower respectively.
Saudi Arabia SE
Current year high: 6,929.40 Current year low: 5,760.33
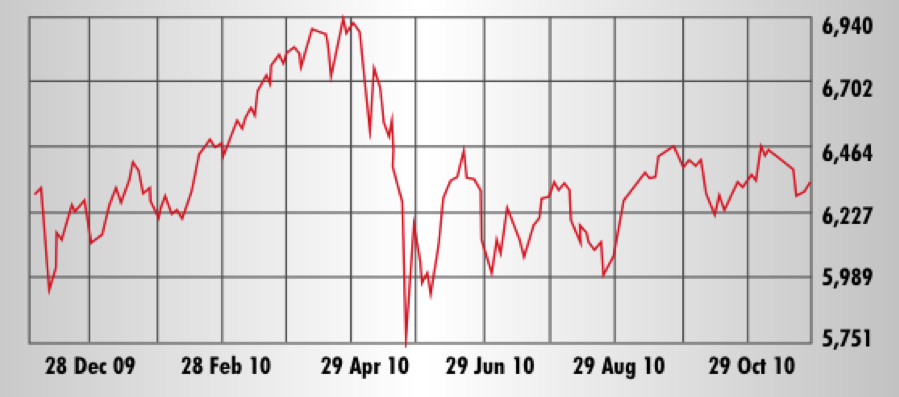
> Review period:
Closed Nov 27 at 6,298.89 Points 47 Week Change: 2.9%
The five trading weeks from October 24 through November 27 reinforced the narrative that, during 2010, up-trends were temporary on the Saudi Stock Exchange and long-term investors had little to fear but also little to gain. Sharply divergent performances of some sectors and companies stood against flattish moves of others. At the top, three new insurers tripled and quadrupled from their issue prices but a number of other insurers recorded significant share-price losses. Investment giant Kingdom Holding and insurance stalwart Tawuniya gained 65% and 51% respectively. Debutants of 2010, namely the aforementioned new insurers and Herfy Food Services (51% up), did well, but the biggest newcomer, Knowledge Economic City, was a disappointing 19.5% down by November 24. Of the SSE sector indices, banking ended 1.8% higher, closest to the benchmark. Energy and Petrochemicals were the best gainers, 13.4% and 12.4% higher. Negative index trends were most pronounced in media, down 30%.
Muscat SM
Current year high: 6,933.75 Current year low: 5,968.36
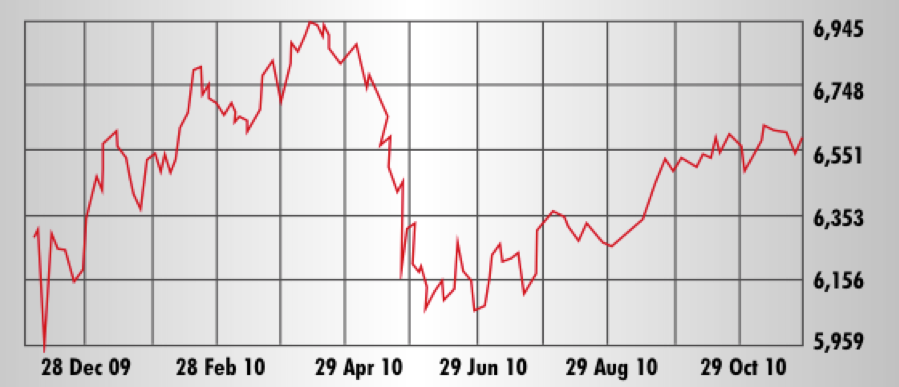
> Review period:
Closed Nov 25 at 6,550.85 Points 47 Week Change: 2.9%
The Muscat Securities Market suffered an incision similar to the Bahraini bourse in late spring but it did a tick or two better in the later months of 2010. This late surge was enough to position the MSM index in second place — albeit barely — among the four gainers in the GCC stock market universe. Poultry specialist A’Saffa Food should be giving its advisors bonuses this year, as its share price quadrupled from March to November, according to data compiled by Zawya. Overall, publicly traded companies in Oman showed far less spectacular share-price increases and the majority of firms found it hard to make headway in 2010. The MSM’s three sector indices for banking, services and industry all showed losses in the review period. When compared with the start of the year, the banking index retreated the most, at 12% down, and severely underperformed the MSM index.
Bahrain SE
Current year high: 1,605.98 Current year low: 1,361.19
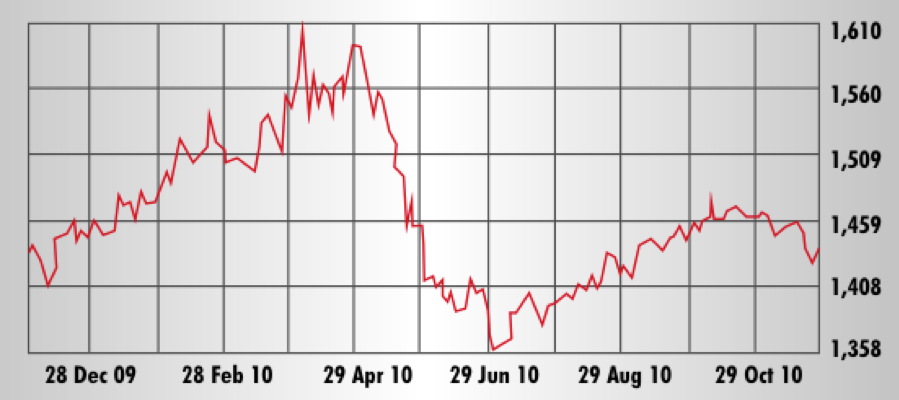
> Review period:
Closed Nov 25 at 1,438.51 Points 47 Week Change: -1.4%
The Bahrain Stock Exchange showed encouraging index trends in spring of 2010. However, the index retreated between late April and early July in a slide of almost 14%, and only partially recovered the lost ground at the end of November. Investors holding shares in Ahli United Bank since the start of 2010 could delight in the scrip’s 68% gain to the November 25 close. This was 30 percentage points better than the gain of the second-best price performer, Bahrain Duty Free. The market was dominated by losers, though. Gulf Finance House closed 55% down from January 1, while Nass Corp and Seef Properties, companies in the stressed construction and real estate sectors, also gave up more than 20% in share prices. Weaker still were three banks: Bahrain Islamic, ABC and Ithmaar fell 31%, 39% and 43%, respectively. Nonetheless, the banking index was the BSE’s positive exception, ending week 47 with a 23.3% gain for the year to date.
Doha SM
Current year high: 8,273.07 Current year low: 6,502.93
> Review period:
Closed Nov 25 at 8,178.77 Points 47 Week Change: 17.5%
Say what you will about Qatar’s uninspiring flat landscape, no GCC peer in 2010 came close to the peaks displayed on the Qatar Stock Exchange. Like its peers, the QSE benchmark index took a beating in late spring. However, the selling pressure turned and the index performed, on the year to date, more than 14 percentage points better than any other Gulf benchmark. All sector indices on the QSE ended the January through November period with gains. Insurance came out on top with a gain of 59%, followed by banking with 26.5%. Rises in the industrial and services indices were in the single digits, thus underperforming the general index. Major players in almost all core sectors, including QNB, Doha Bank, Qatar Navigation, Doha Insurance, Q-Tel and Industries Qatar, achieved double-digit share price gains. Notably, developers Ezdan (QSE market cap leader) and UDC failed to join the climbers in the second half of 2010.
Tunis SE
Current year high: 5,681.39 Current year low: 4,077.39
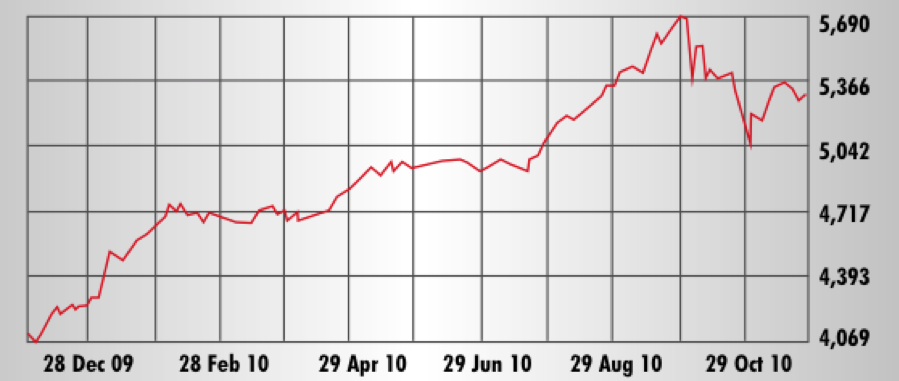
> Review period:
Closed Nov 26 at 5269.48 Points 47 Week Change: 22.8%
The Tunis Stock Exchange was the region’s undisputed winner this year. Although the Tunindex had a losing month in October, its overall growth was above that of all other MENA exchanges covered. Top gainers included three out of four firms that underwent their initial public offerings in 2010, namely Tunis Re (up 55.1%) and Assurances Salim (up 47.3%) in the insurance sector and Carthage Cement (up 93.2%) in heavy materials. Servicom, a telecommunications infrastructure company, was an upward outlier with a 169.4% price gain. Poulina Group Holding, the manufacturing conglomerate that is the TSE leader in market capitalization, recorded a gain of 36.8% from start of 2010. Banque de Tunisie and Banque Internationale Arabe de Tunisie, numbers two and three by market cap, stayed on Poulina’s heels with respective share-price gains of 24.8% and 23.1%. The Tunisian bourse’s volatility over the 47 weeks was 10.4% and the price-to-earnings ratio climbed to 16.29x.
Casablanca SE
Current year high: 12,457.59 Current year low: 9,997.56
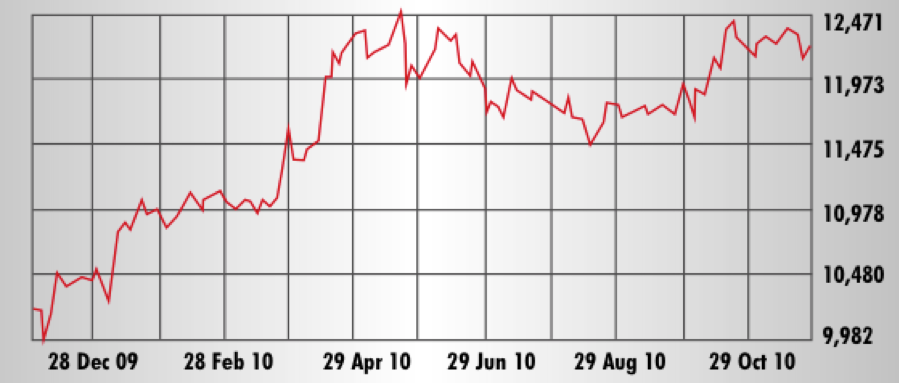
> Review period:
Closed Nov 26 at 12,115.95 Points 47 Week Change: 16%
The performance of the Casablanca Stock Exchange’s MASI matched that of Qatar’s QSE benchmark index at the end of week 47. However, where the QSE index rose from behind in the second half of the year, the MASI stayed closer to the year high it had reached at nearly 12,500 points in May. The CSE’s leading companies by market cap, Maroc Telecom and Attijariwafa Bank, advanced nicely and very nicely in the 47-week review period, with gains of 9.5% and 24.1% by the November 26 market close. The top industrial scrip by market cap, cement producer Lafarge, put even those gains into shadow, climbing 50.3%. Real estate stood out in that the largest listed companies displayed a mixed picture when compared with the benchmark index. Developers CGI and Addoha, which both showed significant fluctuations coming into 2010 and throughout the year, in the end closed with single-digit share price gains.
Egypt CASE
Current year high: 7,603.04 Current year low: 5,850.00
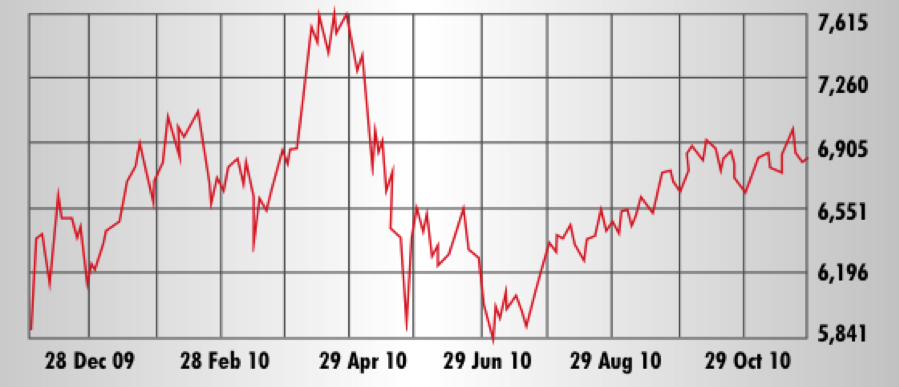
> Review period:
Closed Nov 25 at 6838.00 Points 47 Week Change: 10.1%
The Egyptian Stock Exchange performed a program of two contrasting melodies in 2010. The first tune, played between January and end July, was contrapuntal, entailed strong volatilities and ended with hardly any net change versus the first close of the year. The four months from August through November, however, were much less polyphonic. The EGX 30 Index moved up in a succession of small steps that contained almost all the gains reflected in the November 25 close. Juhayna Food, the only EGX 2010 debutant gained 510% over the issue price and 42% from its June 15 close to November 25. One of Egypt’s higher flying heavies this year was Commercial International Bank whose 56.3% gain propelled it into the position of top bank by market cap and number three on the EGX overall. A year-to-date gain of 10.1% was enough for Orascom Construction to defend the place of market cap leader.