
Population growth rates
Average annual growth in percentage, 1993-2006 or latest available period
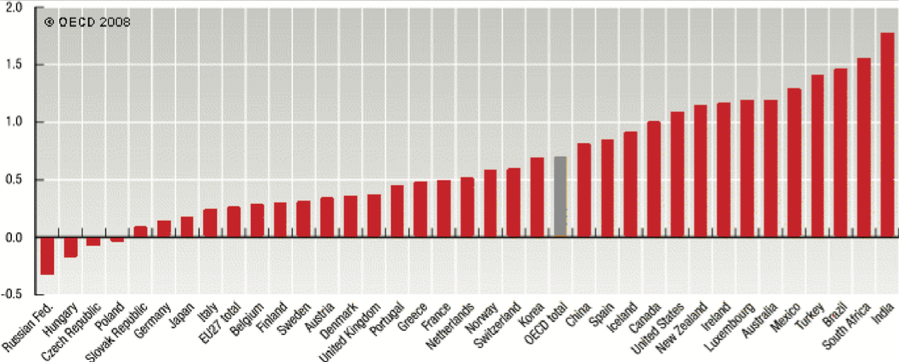
In 2006, OECD countries accounted for 18% of the world’s population of 6.5 billion people. China accounted for 20% of this number and India for another 17%. Within OECD, the United States accounted for 25% of the OECD total, followed by Japan (11%), Mexico (9%), Germany (7%) and Turkey (6%). Between 1993 and 2006, the population growth rate for all OECD countries averaged 0.7% per annum. Growth rates much higher than this were recorded for Mexico and Turkey (high birth rate countries) and for Australia, Canada, Luxembourg, Ireland, New Zealand and US (high net immigration). In the Czech Republic, Hungary and Poland, populations declined from a combination of low birth rates and net emigration. Growth rates were very low, although still positive, in Germany and the Slovak Republic. The population growth of OECD countries is expected to slow down in the coming decade. Until the middle of this century, the population of OECD countries is expected to grow by less than 0.3 per cent per annum. Total fertility rates have declined dramatically over the past few decades, falling on average from 2.7 in 1970 to 1.6 children per woman of childbearing age in 2005. By 2005, the total fertility rate was below its replacement level of 2.1 in all OECD countries except Mexico and Turkey. In all OECD countries, fertility rates have declined for women at younger ages and increased for women at older ages because, on average, women are postponing the age at which they start their families.
GDP defaltor
Average annual growth in percentage
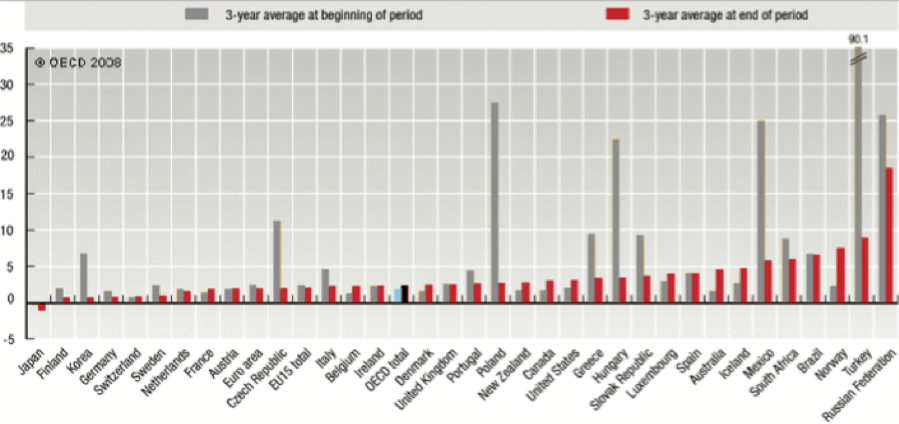
Between 1993-2006, OECD inflation was lowest in 1999 at 1.2%. It then gradually increased to 2.5% in 2006. The average annual inflation over the last three years was below 5% for all OECD countries except Norway, Mexico and Turkey. The volatility in the Norwegian GDP deflator is mostly due to variations in the export prices of petroleum, and these grew very strongly over the last few years. Strong growth in the GDP deflator for Mexico and Turkey reflects general domestic inflation, though both countries have, drastically reduced their inflation from 1993-2006. At the other extreme, Finland, Germany, Korea, Japan, Sweden and Switzerland recorded average annual rates of inflation over the last three years of below 1%. Several countries (Canada, Czech Republic, Finland, Germany, Luxembourg, Norway and Switzerland) recorded deflation between 1993-2006 for one or more years, but Japan is the only country where this has been sustained over several years.
Municipal waste generation
kg per capita, 2005 or latest available year
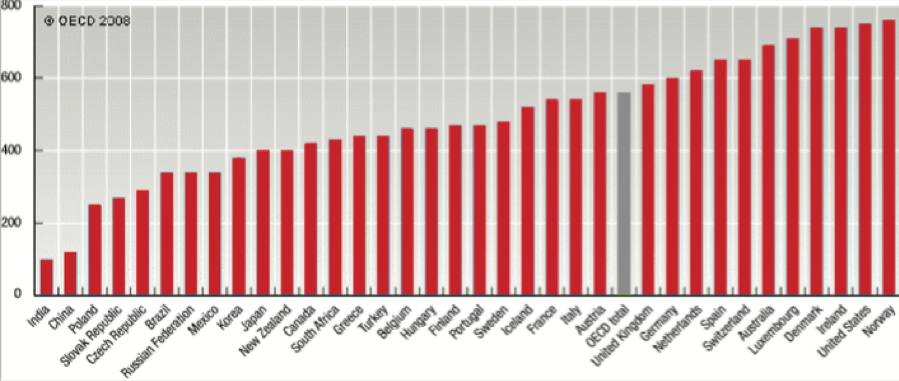
The quantity of municipal waste generated in the OECD area (30 countries) has been rising since 1980 and exceeded 650 million tons in recent years (560 kg per capita). Generation intensity — i.e. kilograms per capita — has risen mostly in line with private final consumption expenditure and GDP, but there has been a slowdown in the rate of growth in recent years. The amount of municipal waste also depends on national waste management practices. Only a few countries have succeeded in reducing the quantity of solid waste to be disposed of. In most countries for which data are available, increased affluence, associated with economic growth and changes in consumption patterns, tends to generate higher rates of waste per capita.
Taxes on the average worker
As a percentage of labor cost
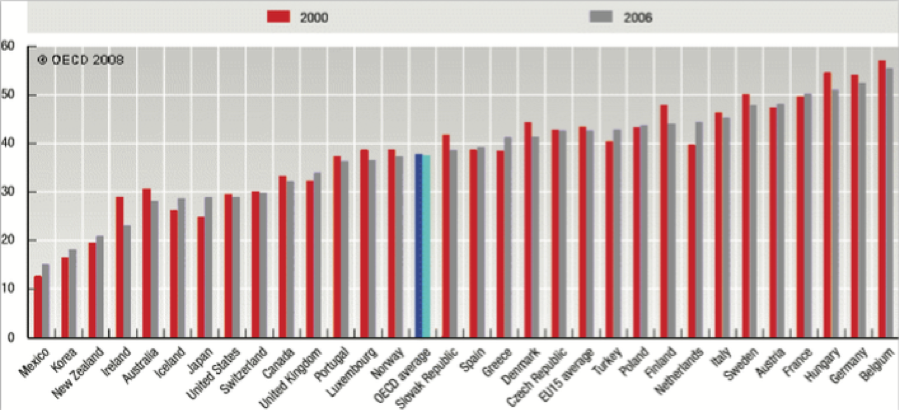
On average, the taxes on an average worker increased until 1997 and have since declined, in both the European Union and the OECD as a whole. However, there are important differences between countries. The countries that have experienced an overall increase in the taxes on an average worker since 2000 include Japan, Mexico and the Netherlands. Countries that have experienced an overall decline include Australia, Denmark, Finland, Ireland, Luxembourg and the Slovak Republic.


