
Prison population
Convicted adults admitted to prisons
Number per 100,000 population
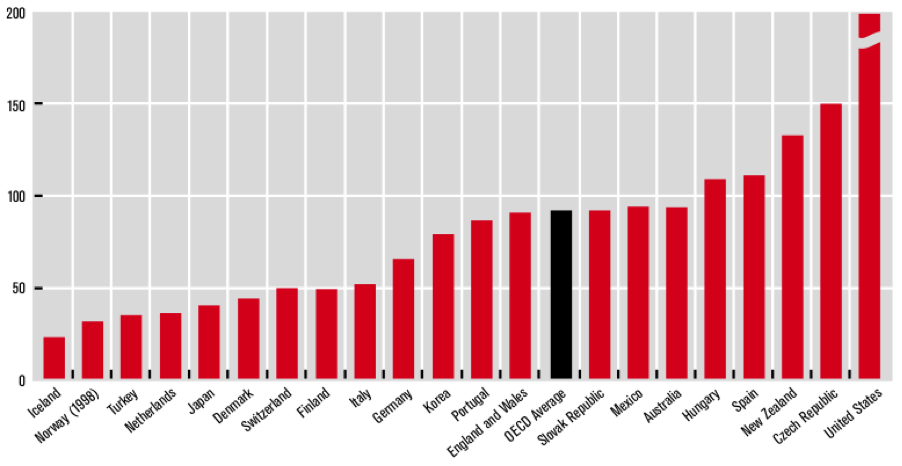
Since the 1970s, OECD countries have experienced steady increases in prison population, with the exception of Finland where the rate has continued to decline. Over the last 10 years, Portugal has recorded one of the largest increases together with Spain among European countries. However, levels in both countries remain far below the United States, where the prison population has witnessed a huge jump that bears no historical comparison, with a population in 2000 four times as high as in the early 1970s. Differences across countries have, surprisingly, only little to do with the prevalence and development of crimes but more likely to do with political factors and responses to the increasing belief in certain countries that prison is preferable to other alternatives. When comparing prison populations in 2000, the United States again stands far above the norm with an incarceration rate five times as high as the OECD average and three times larger than the Czech Republic, ranking second. More than 1.2 million convicted American adults are in jail (a little less than 2 million when pre-trial and non-guilty offenders are included), and this may have a significant distorting role on the labor market for young males. Rising prison populations, unless fully resourced, generally reduce the effectiveness of criminal re-education. Upward trends can pull down the staff-prisoner ratio, a key component for achieving effective prevention of re-offending and promoting reintegration in the community. Moreover, prison overcrowding tends to exacerbate already high levels of tensions and violence, raising the risks of self-injury, suicide and sexually transmitted diseases including HIV/AIDS. Overcrowded prisons are also more likely to act as “universities of crime.”
Migration of the highly educated
Foreign-born persons with tertiary education
As a percentage of all residents with tertiary education
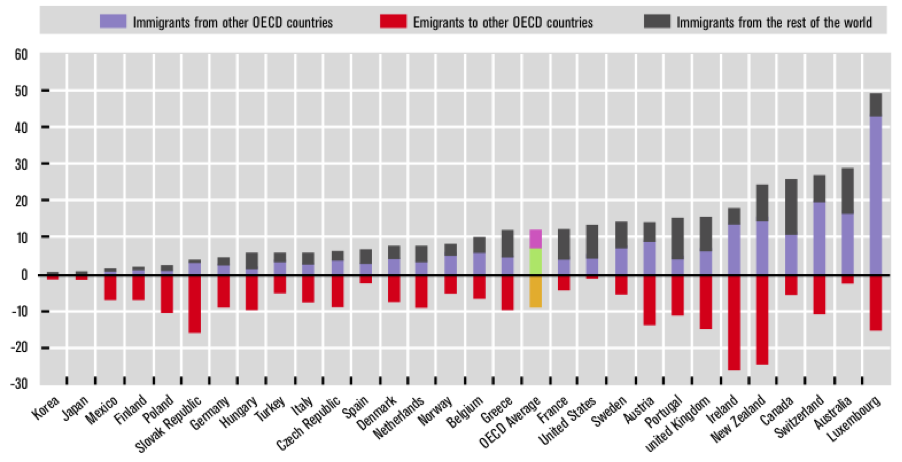
In the total OECD area, about 4% of persons with tertiary education are immigrants from other OECD countries. Those from non-OECD countries account for about 6% of all current residents with tertiary attainment. Net stocks of foreign-born persons with tertiary attainment are highest in the traditional “settlement” countries of Australia, Canada and the United States, but also in Luxembourg and Switzerland. Other countries with a large excess of foreign-born persons with tertiary attainment relative to their nationals living in other OECD countries include Sweden and France (8-9%). On the other hand, countries having a large percentage of tertiary-educated former residents living in other OECD countries include Ireland and New Zealand (at close to 25%); Austria, Switzerland, the United Kingdom, Luxembourg, Poland, Portugal and the Slovak Republic (all at more than 10%); and the Czech Republic, Germany and the Netherlands (at close to 9%).
Long-term unemployment
Persons unemployed for 12 months or more as a percentage of total unemployed, 2004*
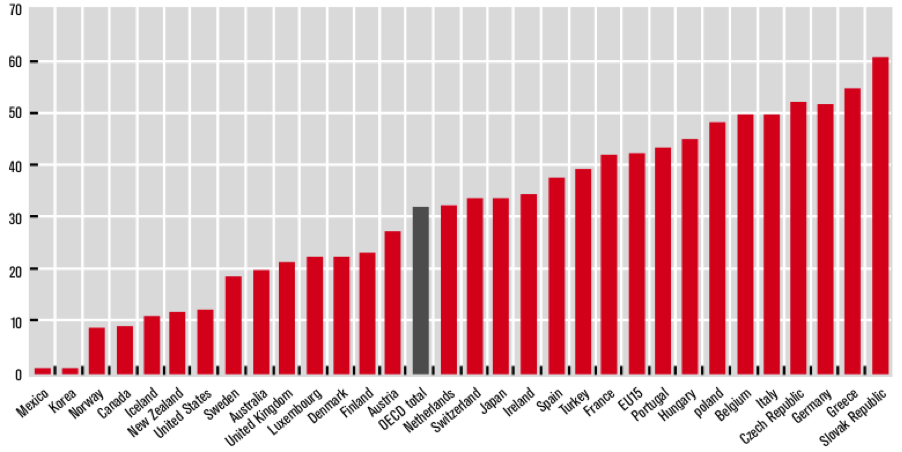
In 2004, rates of long-term unemployment varied from 10% or less in Canada, Korea, Mexico and Norway to 50% or more in the Czech Republic, Germany, Greece and the Slovak Republic. Lower rates of long-term unemployment are generally found in countries that have enjoyed relatively high rates of economic growth in recent years. There appears to be a two-way causal relationship here. On the one hand, jobs are easier to find in a fast growing economy and, on the other, economies may grow faster by making unemployment an unattractive proposition. Over the period shown in the table, long-term unemployment rates have been relatively stable for the OECD as a whole, but there have been some sharp rises in several countries and equally sharp falls in others. Rates of long-term unemployment have more than doubled in the Czech Republic, Hungary, Finland and the United States (albeit from low levels) and have also risen sharply in Iceland (although from very low levels), Japan and Switzerland. On the other hand, there have been large falls in the long-term unemployment rates in Belgium, Ireland, Italy, Luxembourg, Netherlands and Spain. It is noticeable that, since 1990, the share of long-term unemployed has halved in Korea, Norway, Luxembourg, Ireland and New Zealand.
*Latest available figures
Languages on the Web
Top 10 languages used in the Web
( Number of internet users by language )
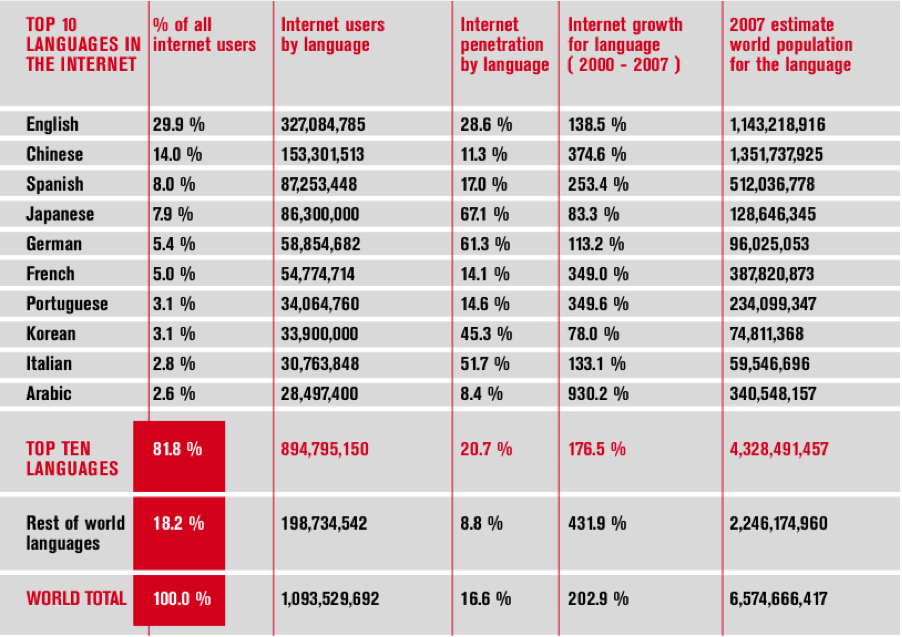
There are 87,253,448 Spanish speaking people using the internet, representing 8.0% of all the Internet users in the world. Out of the estimated 512,036,778 world population that speaks Spanish, only 17.0 % use the internet. The number of Spanish speaking internet users has grown 253.4 % in the last six years (2000-2007). Arabic speakers saw the largest growth—930.2%—although they still has the fewest speakers online (2.6%) and least penetration among speakers (8.4%).
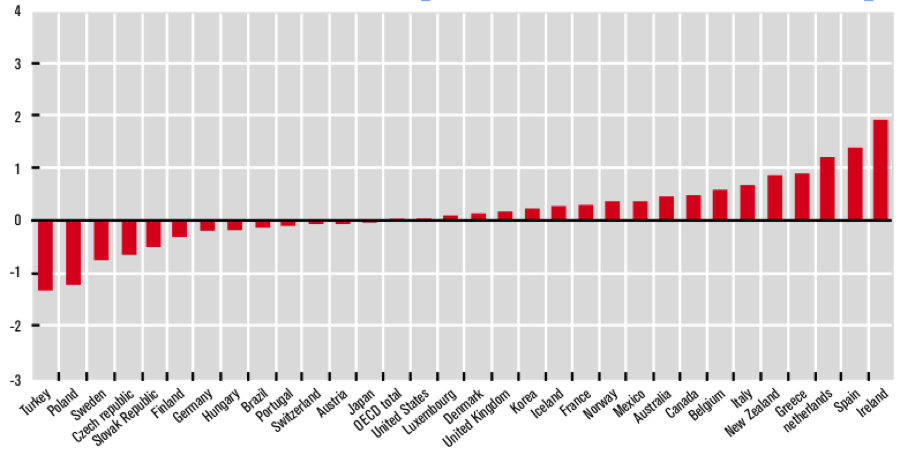
Employment rates by gender
Employment rates: total
Average annual growth in percentage, 1991-2004 or latest available year
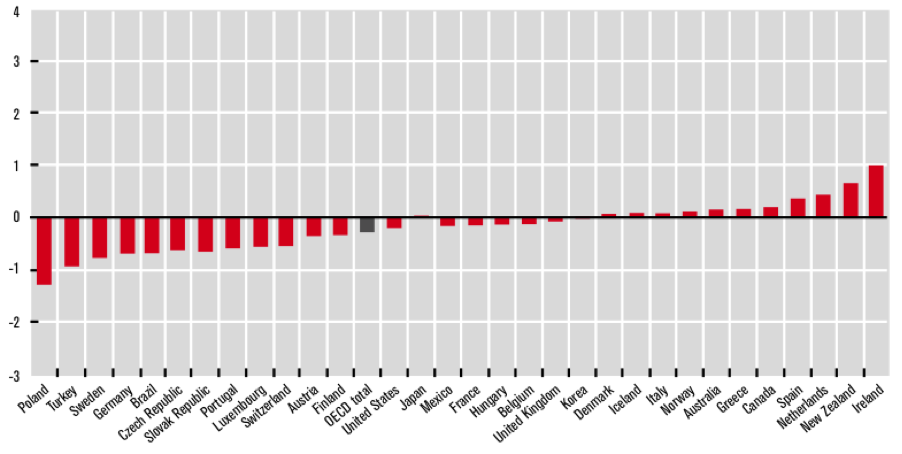
Employment rates: men
Average annual growth in percentage, 1991-2004 or latest available year
Employment rates: women
Average annual growth in percentage, 1991-2004 or latest available year
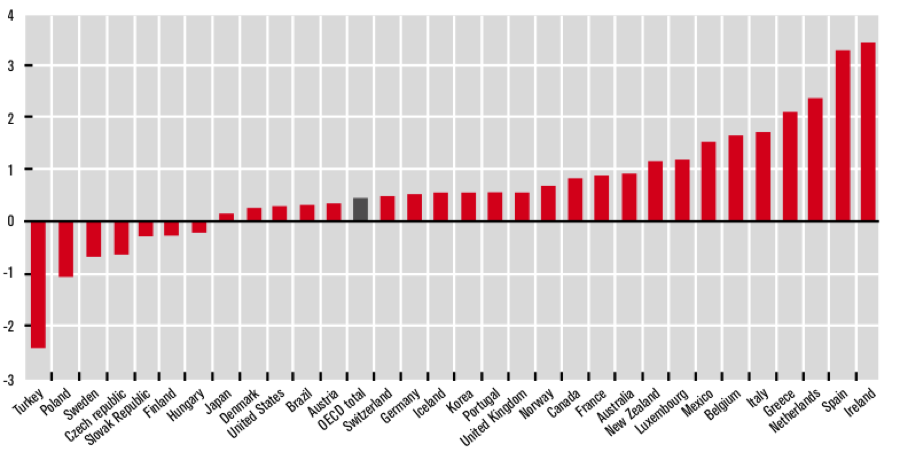
All OECD countries use the ILO Guidelines for measuring employment, but the operational definitions used in national labor force surveys vary slightly in Iceland, Mexico and Turkey. Employment levels are also likely to be affected by changes in the survey design and/or the survey conduct, but employment rates are likely to be fairly consistent over time. For the denominators—the population in each age group—the data are taken from labor force surveys. Over the period shown in the tables, total employment rates (men and women) have fallen in 13 countries and risen in 17. Particularly large falls were recorded in Turkey, Poland, Sweden, Czech Republic and Slovak Republic and particularly large increases occurred in Ireland, Spain and the Netherlands. Growth in employment rates was very different for men and women. Employment rates for men decreased in 19 countries during the period with an annual fall of more than 0.5% in Poland, Turkey, Sweden and Germany. For women, on the other hand, employment rates grew in 23 countries with increases of 1% per year or more recorded for Ireland, Spain, Netherlands, Greece, Italy, Belgium, Mexico, Luxembourg and New Zealand. Clearly, these differences in the growth of employment rates are leading to convergence in the rates for women and men although differences remain large in many countries.