
OECD’s Development Aid Committee (DAC) member country responses to tsunami disaster
Millions of US dollars
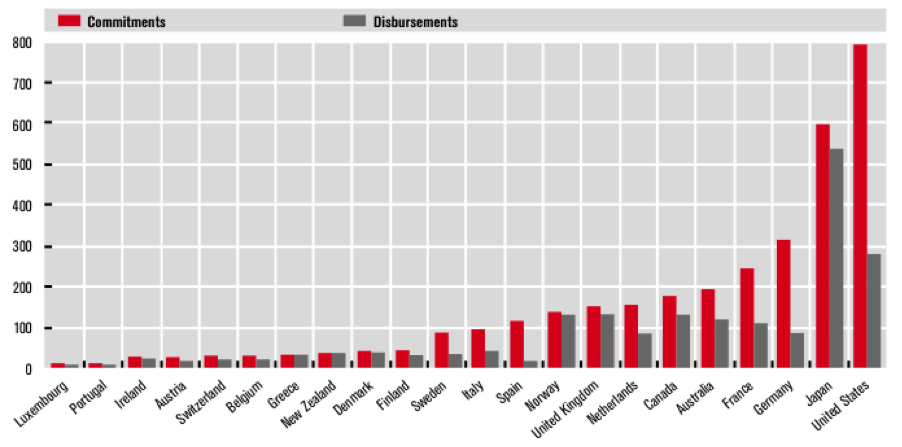
The unprecedented humanitarian response to the Indian Ocean tsunami prompted governments, international organizations, private individuals, charities and companies to pledge $13.6 billion to the affected countries. Of that, $5.3 billion was from OECD member governments, and a further amount from private citizens in OECD countries.
Donor governments and the European Commission have committed $1.7 billion to emergency aid and $1.9 billion to longer-term reconstruction projects, to be spent by 2009. More than 90% of the emergency aid – nearly $1.6 billion – was spent in the nine months immediately following the disaster. For reconstruction, $473 million has been spent, leaving $1.4 billion committed and in the pipeline for spending over the coming years.
Together, Indonesia and Sri Lanka have received more than 60% of the funds committed so far.
Telephone access
Number of telecommunications access paths per 100 inhabitants in 2003
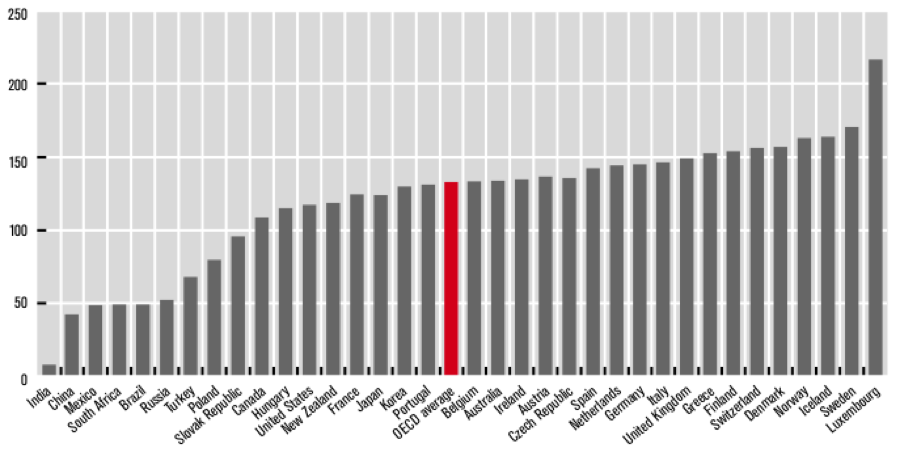
Access to communication networks continues to expand in all OECD countries. At the end of 2003, the total number of fixed and mobile telecommunications paths had increased to more than 1.4 billion. This represented a 6.7% increase over 2002 and an average increase of more than 12% in each year since 1998.
For the first time, however, growth was not occurring across all access paths. The number of cellular mobile communication subscribers continues to climb. An additional 69 million mobile subscribers were added in 2003. By way of contrast, some segments of the fixed connection market have begun to decrease. The number of fixed access lines decreased in both 2002 and 2003 and will most likely continue to do so over the coming years.
Since 1991, growth in access paths per inhabitant has been particularly high in those countries that started from a low base – Hungary, the Czech Republic and Mexico – and somewhat slower in those where the number of access paths per inhabitant were already quite high, such as Canada and the United States.
By 2003, all but four OECD countries – Mexico, the Slovak Republic, Turkey and Poland – had more than one telecommunications access path per inhabitant and eight countries reported more than one and a half per inhabitant – Denmark, Finland, Greece, Iceland, Luxemburg, Norway, Sweden and Switzerland.
Among the five non-OECD countries, growth has been spectacular in China, which had less than one access path per 100 inhabitants in 1991, but more than 40 in 2003. For four of the five non-members, access paths per inhabitant are between 40 and 50, with India as the exception. Although there has been steady growth over the period, there were still only about six access paths per 100 inhabitants of India in 2003.
Arrivals of non-resident tourists staying in hotels and similar establishments
Average annual growth in percentage, 1998-2005
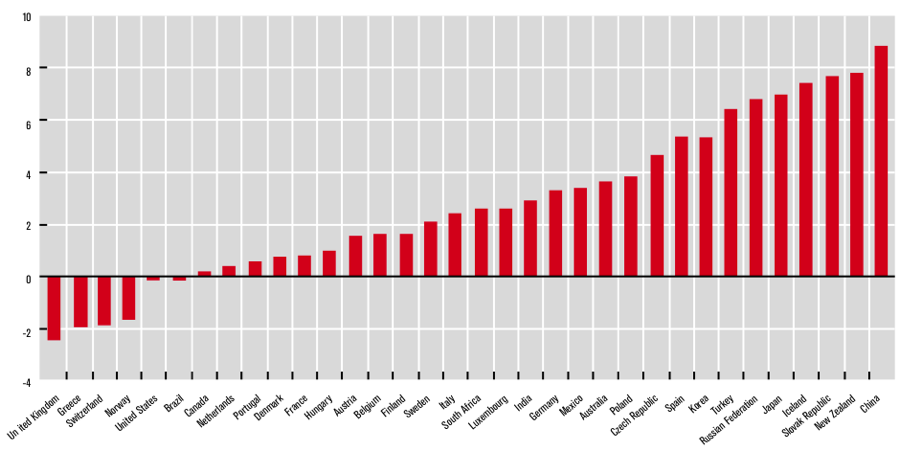
Over the period as a whole, the United States recorded the largest number of arrivals in hotels and similar establishments followed by France, Italy and Spain. In general, the larger countries record the highest number of arrivals, although Austria and Greece are relatively small countries with a high number of arrivals, and Japan and Mexico are large countries but record relatively low numbers.
The 9/11 terrorist attacks resulted in sharp falls in arrivals in the United Kingdom and the United States but did not noticeably affect arrivals in most other countries. Countries in central and eastern Europe have recorded strong increases in arrivals since 1990. The above graph shows annual growth in arrivals of non-residents averaged over the period since 1998. Arrivals declined in the United Kingdom, Greece, Switzerland, Norway and the United States, but grew at 6% per year or more in Turkey, Japan, Iceland, the Slovak Republic and New Zealand. Among the five non-members, growth was particularly high in the Russian federation and China.
Tourism 2020 Vision is the World Tourism Organization’s (WTO-OMT) long-term forecast and assessment of the development of tourism up to the first 20 years of the new millennium. Although the evolution of tourism in the last few years has been irregular, the WTO-OMT maintains its long-term forecast for the moment. The underlying structural trends of the forecast are believed not to have significantly changed. Experience shows that in the short term, periods of faster growth (1995, 1996, 2000) alternate with periods of slower growth (2001 and 2002).
WTO-OMT’s Tourism 2020 Vision forecasts that international arrivals will reach over 1.56 billion by the year 2020. East Asia and the Pacific, South Asia, the Middle East and Africa are forecasted to record growth at rates of over 5% per year, compared with the world average of 4.1%. The more mature tourism regions, Europe and the Americas, are expected to show lower than average growth rates. Europe will maintain the highest share of world arrivals, although there will be a decline from 60% in 1995 to 46% in 2020.