

Key economic data for the six polities and jurisdictions yield limited or indirect information on the impact of armed interstate and asymmetric Arab-Israeli conflicts and specifically the October 7, 2023 Hamas intrusion into Israel, Israel’s state actions against the Gaza strip with the declared rationale of smashing Hamas, the aggression of militant Hezbollah and Houthi entities from Lebanon and Yemen, the confrontations between Israel and Iran, the Israeli pummeling of Lebanon, the Israeli actions vis-à-vis post-Assad Syria, and all related destruction or economic damage. The data and indicators in the infographic overleaf do, however, illustrate the economic productivity and the global perceptions thereof in the last fifty years, the last decade, and the current outlooks and perceived potentials. As shown in the data, the disparities between countries are blatant, signs of regional integration of Mashreq or Near Eastern, economies, are absent.
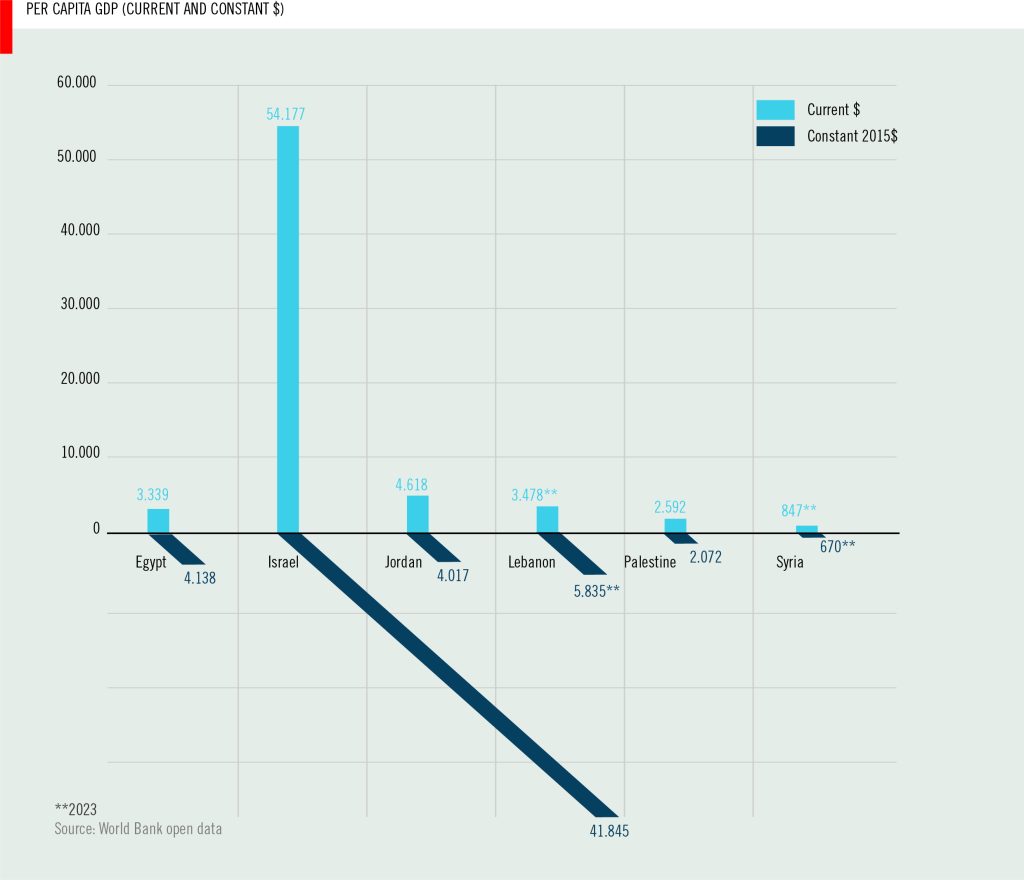
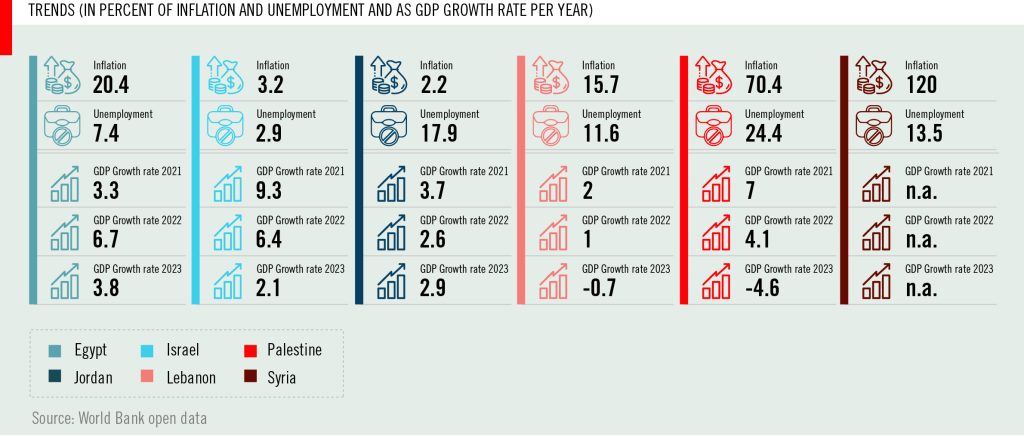
Data on per capita performances and trends in unemployment, inflation, and GDP growth during the time of the 7th Arab-Israeli conflict are both revealing absolute misalignments and vast discrepancies in per capita GDP and growth thereof between Israel on one and the other five polities on the other. At the same time, the same data trends leave no doubt that all of the polities in their economic existences are under the rule of the principles that apply to all economies in the world; there is no superpower or that exists outside of or in immunity to realities and principles.
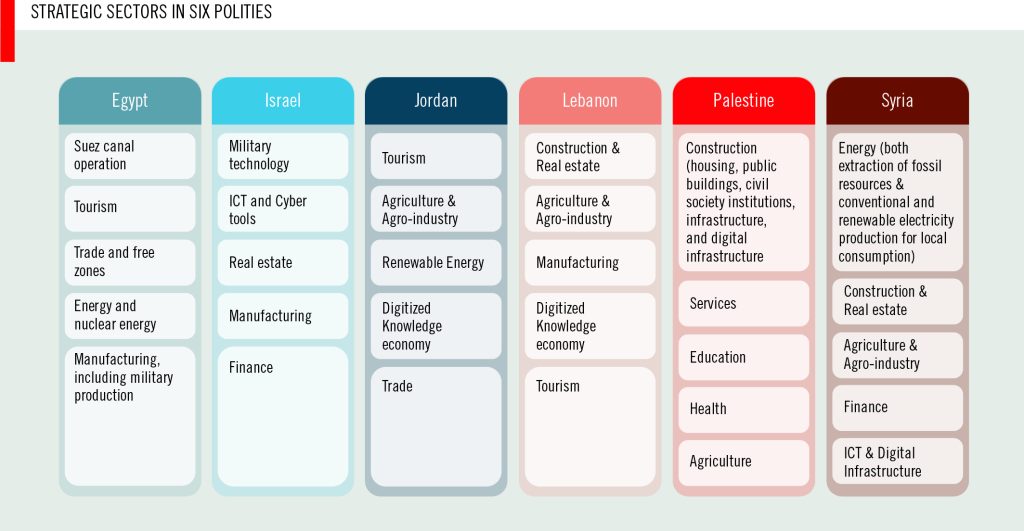
The economic profiles of key or strategic sectors do not show alignments under any regional development and integration perspective. They do not offer reasonable growth indicators or use of synergies, not for the Arab polities and their innovative interaction, and definitely not for Arab-Israeli, or in the original meaning of the weaponized, ethno-mythical term “Semite” intra-semitic, economic and socioeconomic reconciliation. The indices cited in as evidence of both realities on the ground and the global image of these realities that has been promulgated as part of a multi-decade trend to divide the productivity potentials of in their ancestries closely Semites into groups of which one has for the last 80 years been portrayed with highly favorable narratives and the other at least equally vilified despite their economic proves.
Index data and rankings in this infographic show the predilections and biases of their issuers until two of the two most-cited index series were halted at the end of the 2010s. ICT, innovation, and Artificial Intelligence related indices are showing moreover the persistence of gaps in index performance that must be expected to only widen further unless corrected both from underlying realities and regulations and from the side of biased indicator choices.
Sources and data used
World Bank Open Data series rely on a number of data sources. Per capita GDP in current USD advanced form 601.5 in 1965 to 13,664 in 2024. Per capita in constant 2015 dollar for the world is 11,876 USD. Current GDP dollar values are nominal, ie are values that are changed by inflation. Constant GDP data use a baseline year (2015) and show the GDP true volume development as per that year’s monetary power. In inflationary environments, current GDP figures will be higher than constant GDP figures, the (rare) inverse applies with deflation.
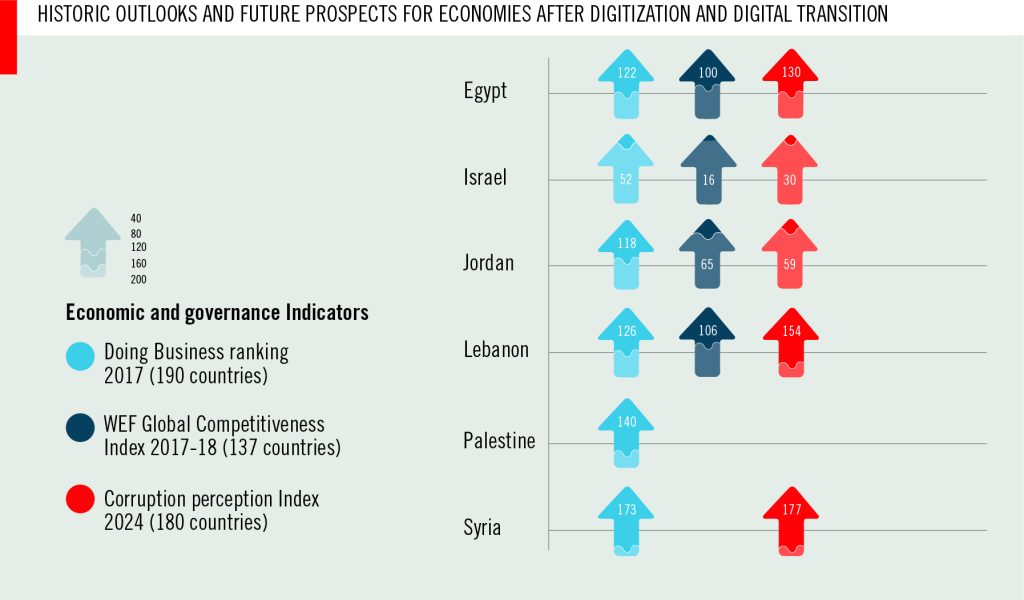
The World Bank Doing Business report and ranking was a “flagship” report of the institution, until it wasn’t any longer. The series was discontinued in some disgrace in 2019. Covering “regulations that enhance business as well as those that restrain it” domestically in almost all jurisdictions around the world, Doing Business Reports toward the end of the series listed assessed countries on a scale from 0 to 100. It ranked countries by ten regulatory pillars, plus noted labor market regulations as not ranked category. The effective range in 2017 edition, the 14th, was from New Zealand in top spot with 87 points, to Somalia with 20.3 points. Values for the six countries covered here ranged from Israel’s 71.6 to 41.4 in Syria.
The World Economic Forum’s Global Competitiveness Report and Index was a flagship product of Switzerland-based WEF until 2020. It was discontinued amid allegations of its manipulation. The 2017-18 edition listed 137 countries on a scale from zero to 10. Top in the report were Switzerland and USA with 5.86 and 5.85 scores. The bottom-ranked Yemen had a score of 2.87 points according to parameters that according to the index legend quantified the institutions, policies, and factors that determine a country’s level of productivity. Scores for the countries in this review ranged from Israel’s 5.31 to 3.84 for Lebanon. Two topical countries of this paper, Palestine and Syria, were absent from the ranking.
The Corruption Perception Index of Transparency International covers 180 countries as meta-index of perceived levels of corruption. The 2024 edition characterizes corruption as “dangerous problem in every part of the world”. Comparing the 2014 CPI edition to its 2012 iteration, the report says nearly 18 percent of indexed countries showed improvements but acknowledged that over 82 percent of countries were stagnant or regressed in their perception of cleanliness and transparency. Scores range from zero to 100, with Denmark being the country perceived as cleanest with 90 points and South Sudan in place 180 scoring 8 out of 100. Israel has a score of 64, Syria a score of 12. Running the mouse over the territory of Palestine shows no data, despite a differentiation of its geography from Israel.
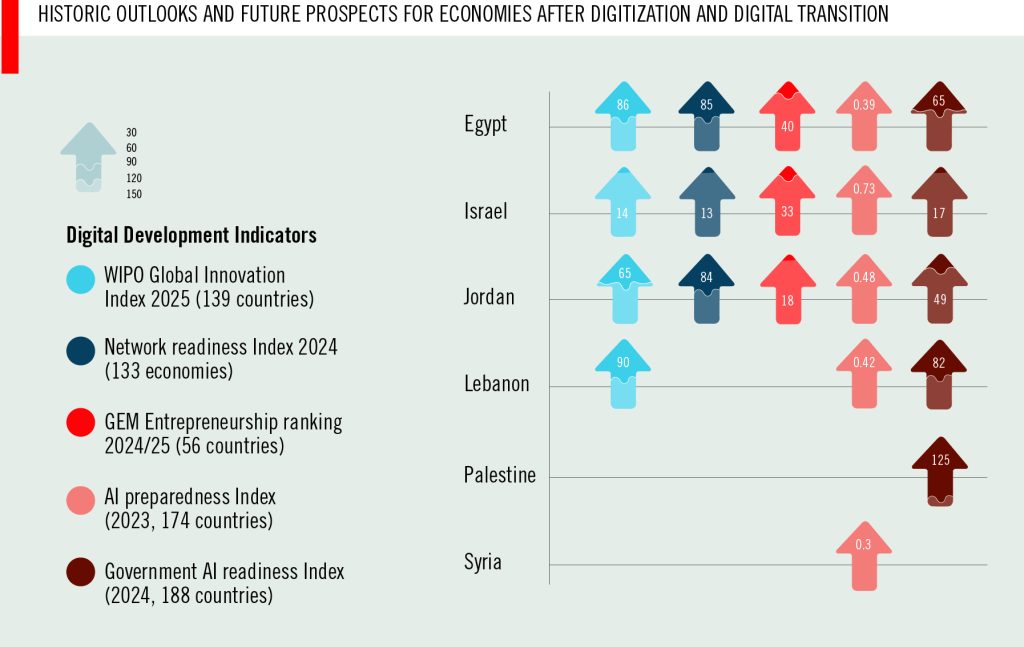
The 2025 Global Innovation Index of the World intellectual Property Organization (WIPO) and Portulans Institute ranks 139 economies and top 100 global innovation clusters by technological developments and rates of tech adoption as well as socioeconomic impact and investment patterns. Scores are awarded from 1 to 100 and additionally segmented by four income groups and seven world regions. The scores de fact stretch from 66 for top-ranked Switzerland to 11.9 for lowest ranked Niger. Israel is the highest scorer of our coverage group at 52.3 and top ranker for the northern Africa and Western Asia region. Syria and Palestine are not in the ranking, which leaves Lebanon as tail scorer at 23.6. Tel-Aviv-Jerusalem (ranked 19) and Cairo (83) are the two innovation clusters shown among the world’s top 100 innovation clusters according to the GII. Increases in MENA GII rankings are mentioned for some countries in the region, with Jordan the single country from our coverage group in the group of fast risers.
The Network Readiness Index by US-based think tank Portulans and Oxford University lists 133 countries and offers four-tiers of income categorization and six geographic categories for these. It aims to measure countries’ preparedness for digital transition and leveraging of digital technologies for economic and societal benefits. Scaled from 1 to 100, the 2024 Index shows the USA in top rank with a score of almost 79 points, followed by Singapore with 76.94. Yemen, with 20.24 points is ranked in 133rd and last place. The scores for countries in this report are 70.46 for Israel, 47.04 for Jordan, and 44.4 for Egypt.
The eponymous entrepreneurship report of the Global Entrepreneurship Monitor (GEM) covers 56 economies. Findings are structured by three income groups and assessed as social foundations, drivers, and targets of entrepreneurs through reiterative annual surveys. Findings are scaled from 1 to 10; front runners in 2025 were the United Arab Emirates with a score of 7.1. Lowest scorer was Bosnia Herzegovina with 3.4. Only three of this paper’s countries are mentioned in the GEM, with Jordan highlighted as the best performer of the group with a score of 5.0, followed by Israel with score of 4.5 and Egypt with 4.2.
The IMF AI Preparedness Index covers 174 countries with 4 measurement pillars (hard data and perception surveys) that constitute the index: the pillars include digital infrastructure, human capital, innovation & economic integration, regulation and ethics. The range is from zero to one, but the de-facto range is from 0.18 for the Central African Republic to 0.77 for the United States of America. There are numerous countries with “no data” but Palestine is not even shown as such, Palestine (WBG) is omitted from the list of countries. The index entries are values, no ranks are provided.
The Government AI Readiness Index by private sector consulting firm Oxford Insights covers 40 categories in three pillars, government, technology, data & infrastructure. The index’s country values are shown on scale from 0 to 100, thus different from the AI preparedness index only in form of decimals. The Index shows de-facto Government AI readiness to range for Yemen in rank 188 with index value of 14.6/100 to the US in rank 1 with an index value of 87.3/100. The values for the six countries in our coverage are Egypt 55.6; Israel 74.5; Jordan 61.6; Lebanon 46.7; Palestine 37.5. Palestine is identified as “State of Palestine”, yet Syria is not shown as a country the interactive index map.
Our list of strategic sectors in the economies of the five polities have been produced from a combination of international reports and own assessments. With regard to total cost of economic recovery from conflict and/or economic return to sustainability, Executive did not come across a single credible source of information for the total cost of economic rebuilding and recovery after the October 2023-October 2025 period or any portion thereof. A mix of disparate sources and own estimations was used. All data are provided for purposes of illustrating socioeconomic realities and potentials, or the lacking thereof, and should not be relied on as baselines for economic development project plans or investments.